

HOT TOPICS LIST
- MACD
- Fibonacci
- RSI
- Gann
- ADXR
- Stochastics
- Volume
- Triangles
- Futures
- Cycles
- Volatility
- ZIGZAG
- MESA
- Retracement
- Aroon
INDICATORS LIST
LIST OF TOPICS
PRINT THIS ARTICLE
by Matt Blackman
It's been one heck of a year so far. But there are signs that stocks are due for a rest at the very least. But could a more serious correction be just around the corner?
Position: N/A
Matt Blackman
Matt Blackman is a full-time technical and financial writer and trader. He produces corporate and financial newsletters, and assists clients in getting published in the mainstream media. He is the host of TradeSystemGuru.com. Matt has earned the Chartered Market Technician (CMT) designation. Find out what stocks and futures Matt is watching on Twitter at www.twitter.com/RatioTrade
PRINT THIS ARTICLE
DIVERGENCE INDEX
Negative Divergences In Stocks - Another Warning Sign?
04/04/13 04:44:45 PMby Matt Blackman
It's been one heck of a year so far. But there are signs that stocks are due for a rest at the very least. But could a more serious correction be just around the corner?
Position: N/A
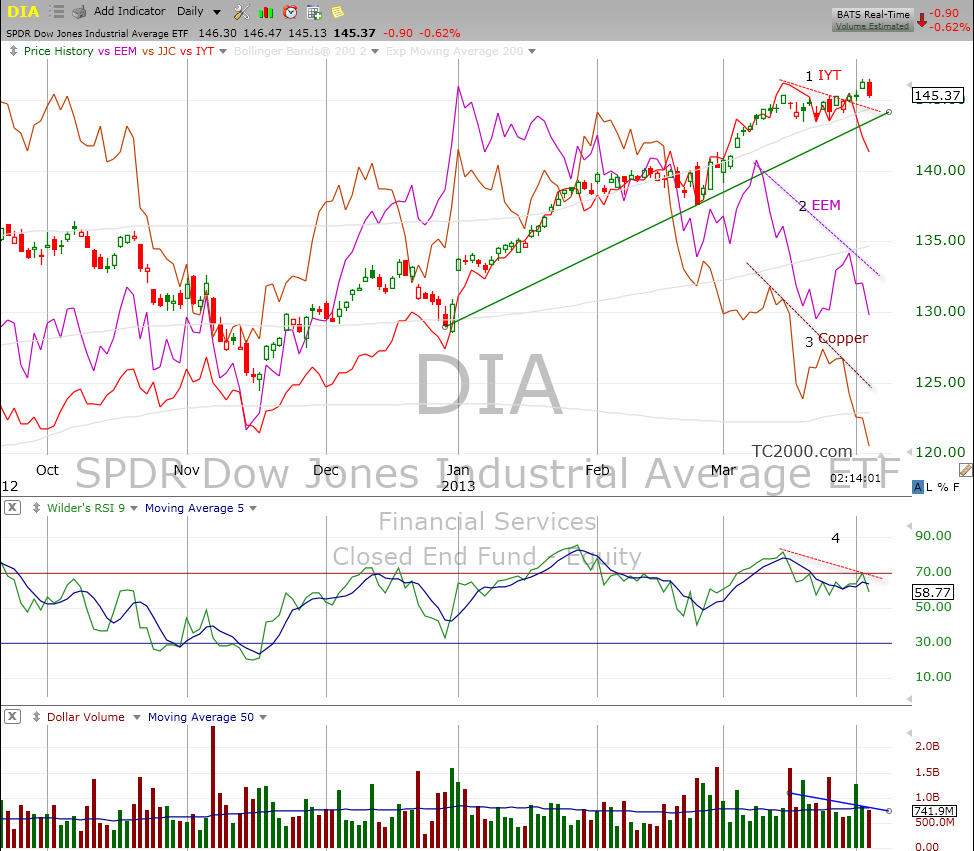
| Q1 - 2013 was a great time to be in stocks. By April 2, 2013 the Dow Jones Industrial Average had advanced more than 9%. As you can see from Figure 1, the SPDR Dow Jones Industrial Average ETF DIA enjoyed a strong up trend and it's a trend that was still in force in early April, 2013. The same, however, cannot be said of the Dow Transports (IYT), emerging markets (EEM) or copper (JJC), all of which have either recently broken uptrend support lines (IYT) or have been in correction mode since the New Year (EEM and JJC). |
|
| Figure 1 � Daily chart comparing the performance of the SPDR Dow Jones Industrial Average ETF (DIA) with the iShares Dow Jones Transports Average ETF (IYT), the iShares MSCI Emerging Markets Index ETF (EEM) and the iPath Dow Jones UBS Copper Total Return ETF (JJC) showing the strong negative divergences between IYT, EEM and JJC with DIA. Also note the DIA � RSI negative divergence � more evidence of a potential top. |
| Graphic provided by: TC2000.com. |
| |
| So why should traders take notice? In the early stages of a stock rally, Transports generally lead. And at a minimum, they should match directional moves with Industrials, according to Dow Theory. When the two groups diverge, bulls get concerned. As Figure 1 shows, IYT recently broke uptrend support. Next, copper is a good economic indicator because it climbs during periods of growth when demand for new cars, houses, and commercial buildings is expanding and then declines as the economy slows -- a characteristic that has earned it the economic nick name Dr. Copper. Its ETF, JJC, has been trending down since the New Year. Finally, look at the Relative Strength Index (RSI) of DIA (middle window Figure 1). While the DIA was putting in higher highs, the RSI was trending lower, which is a sign of falling momentum. As a trading tool, divergence is highly discretional. At times, negative divergence can continue for weeks or even months, and at other times prices follow quickly. But in both cases unless divergence disappears, price must ultimately follow at some point. |
|
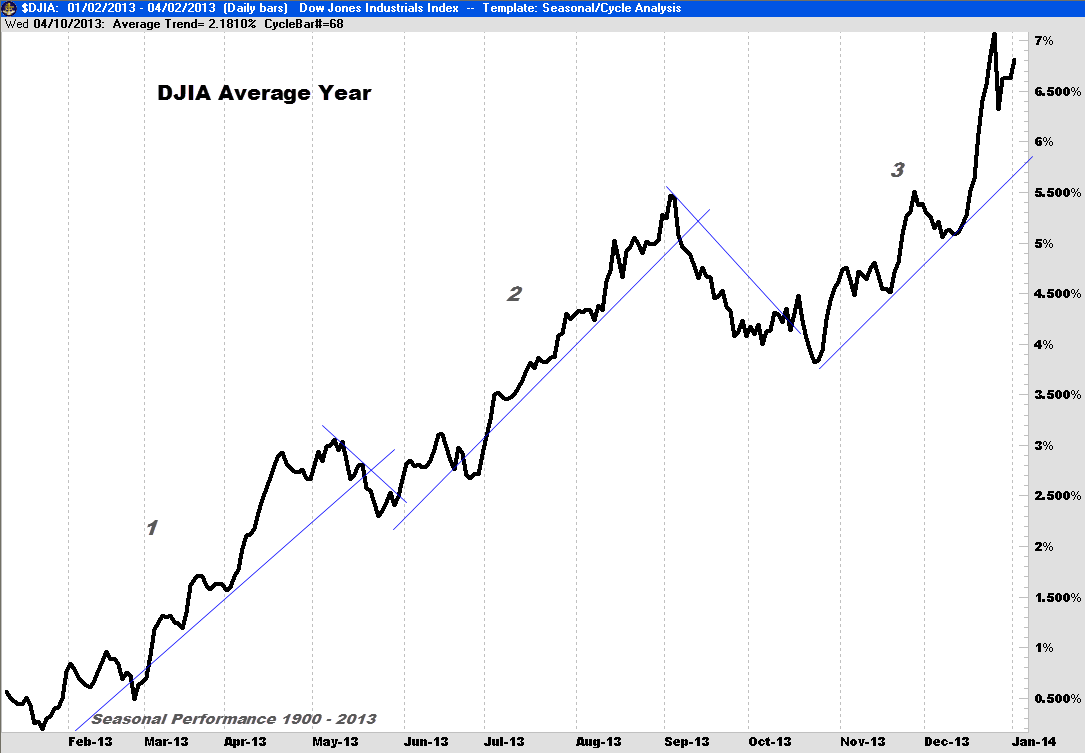
| Figure 2 � Composite chart showing how the Dow Jones Industrial Average performed in the average year between 1900 and 2013 indicating the three periods of strength. |
| Graphic provided by: www.GenesisFT.com. |
| |
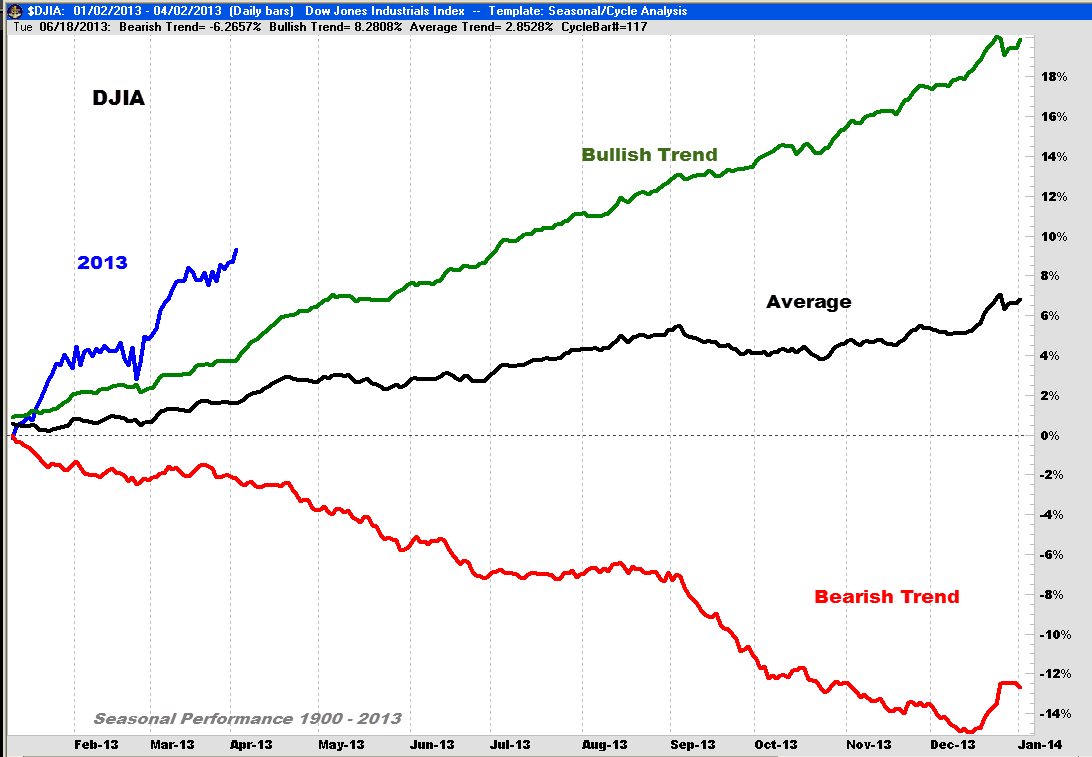
| Seasonal Performance Next, we look at an "average year" for the Dow which is a composite of 112 years (Figure 2). The first period of seasonal strength occurs between mid-January and early May. Next, the period from June 1 through August 30 is strong. Finally, the Dow has a habit of rallying from the third week of October to the third week in December. Now let's put this in context with averages of the up years (bullish trend) and down years (bearish trend). As we see, Q1 2013 has performed well, posting more than a 9% gain or almost 50% better than the average year (Figure 3). Assuming the trend continues, 2013 is on track to be the fifth consecutive up year from the 2009 low. If so, this would only be the fourth time since 1900 that the index has enjoyed five consecutive up years. The three previous years this occurred were 2007 (+4.6%), 1995 (+34.4%) and 1989 (+31.03%). |
|
| Figure 3 � The same chart for the DJIA with showing the average performance of up years (bullish trend), down years (bearish trend) with the year Q1 - 2013 in blue. |
| Graphic provided by: www.GenesisFT.com. |
| |
| Total Picture Takeaway Stocks are generally strong well into May and 2013 has so far been a banner year; both favor bulls at least till May. But there are a number of signs that indicate this rally is getting long in the tooth - very long if you look at history. And we know that the longer bearish divergence continues to impact US stocks, the greater the chance for a correction and the bigger that correction could ultimately be. One silver lining to the bearish technicals is that the next correction could provide great entries for channel traders and dip buyers sitting on the sidelines once it's over, that is assuming the rally regains traction. |
Matt Blackman is a full-time technical and financial writer and trader. He produces corporate and financial newsletters, and assists clients in getting published in the mainstream media. He is the host of TradeSystemGuru.com. Matt has earned the Chartered Market Technician (CMT) designation. Find out what stocks and futures Matt is watching on Twitter at www.twitter.com/RatioTrade
| Company: | TradeSystemGuru.com |
| Address: | Box 2589 |
| Garibaldi Highlands, BC Canada | |
| Phone # for sales: | 604-898-9069 |
| Fax: | 604-898-9069 |
| Website: | www.tradesystemguru.com |
| E-mail address: | indextradermb@gmail.com |
Traders' Resource Links | |
| TradeSystemGuru.com has not added any product or service information to TRADERS' RESOURCE. | |
Click here for more information about our publications!
Comments
Date:�04/08/13Rank:�5Comment:�

Request Information From Our Sponsors
- VectorVest, Inc.
- Executive Premier Workshop
- One-Day Options Course
- OptionsPro
- Retirement Income Workshop
- Sure-Fire Trading Systems (VectorVest, Inc.)
- Trading as a Business Workshop
- VectorVest 7 EOD
- VectorVest 7 RealTime/IntraDay
- VectorVest AutoTester
- VectorVest Educational Services
- VectorVest OnLine
- VectorVest Options Analyzer
- VectorVest ProGraphics v6.0
- VectorVest ProTrader 7
- VectorVest RealTime Derby Tool
- VectorVest Simulator
- VectorVest Variator
- VectorVest Watchdog
- StockCharts.com, Inc.
- Candle Patterns
- Candlestick Charting Explained
- Intermarket Technical Analysis
- John Murphy on Chart Analysis
- John Murphy's Chart Pattern Recognition
- John Murphy's Market Message
- MurphyExplainsMarketAnalysis-Intermarket Analysis
- MurphyExplainsMarketAnalysis-Visual Analysis
- StockCharts.com
- Technical Analysis of the Financial Markets
- The Visual Investor