

HOT TOPICS LIST
- MACD
- Fibonacci
- RSI
- Gann
- ADXR
- Stochastics
- Volume
- Triangles
- Futures
- Cycles
- Volatility
- ZIGZAG
- MESA
- Retracement
- Aroon
INDICATORS LIST
LIST OF TOPICS
PRINT THIS ARTICLE
by Donald W. Pendergast, Jr.
Over the past three weeks, small-cap stocks have struggled even as their large-cap brethren have been marching higher toward an all-time high.
Position: N/A
Donald W. Pendergast, Jr.
Freelance financial markets writer and online publisher of the Trendzetterz.com S&P 500 Weekly Forecast service.
PRINT THIS ARTICLE
CHART ANALYSIS
Small Cap And Large Cap Stocks Diverging
04/03/13 04:02:32 PMby Donald W. Pendergast, Jr.
Over the past three weeks, small-cap stocks have struggled even as their large-cap brethren have been marching higher toward an all-time high.
Position: N/A
| Traders and investors alike are keenly aware that the major US stock indexes are at or near all-time highs, highs that are occurring more than four years after the markets put in a major bottom in early 2009. And while nothing exceeds like excess (it being possible the markets move higher for months to come), common sense would seem to be warning that just about anything can happen now and that the biggest surprises will likely occur toward the downside in both individual stocks and broad markets alike. Today's sudden decline in Hewlett-Packard Company (HPQ) should be evidence enough of that; let's look at a couple of charts now to see what clues they hold regarding the health of the current, 49-month old bull market. |
|
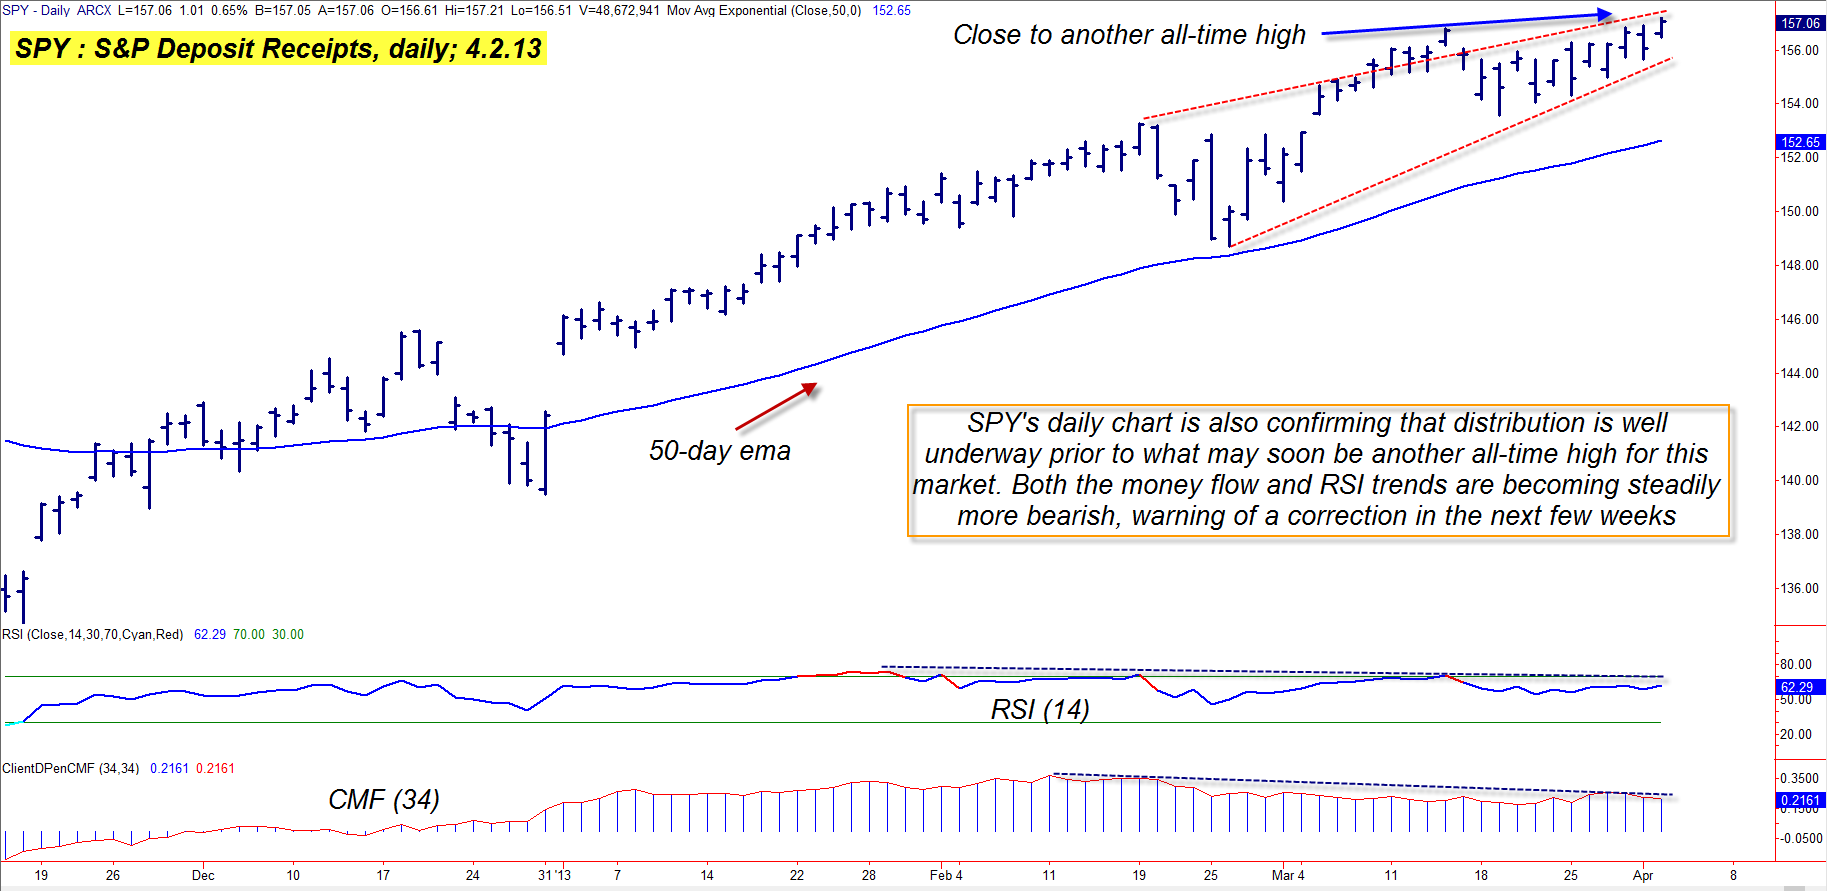
| Figure 1: Evan as SPY grinds higher — possibly to a new all-time high soon — it keeps losing upward price momentum as the 'smart money' distributes their shares to less savvy traders and investors. |
| Graphic provided by: TradeStation. |
| |
| SPDR S&P 500 ETF's (SPY) monthly chart (not shown) clearly reveals that the area between 155.75 and 157.52 is an area of major resistance; giant bear markets ensued each time these levels were previously reached (March 2000 and October 2007, respectively) and since SPY is now only a few decimal points shy of reaching its previous all-time high (157.52) at a time when its four-year old bull market is showing signs of cracking, traders and long-term investors need to be prepared for the possibility of a major correction and/or bearish trend reversal in the weeks and months just ahead. Looking at SPY's daily chart (Figure 1), note that although SPY continues to grind higher, it is quickly losing money flow and price strength momentum. Simply put, even though money managers are now putting more money to work in large caps than in small caps, the day will soon come when there won't be any more buying demand at higher prices and the SPY will correct, just as iShares Russell 2000 Index ETF (IWM) has already begun to do. |
|
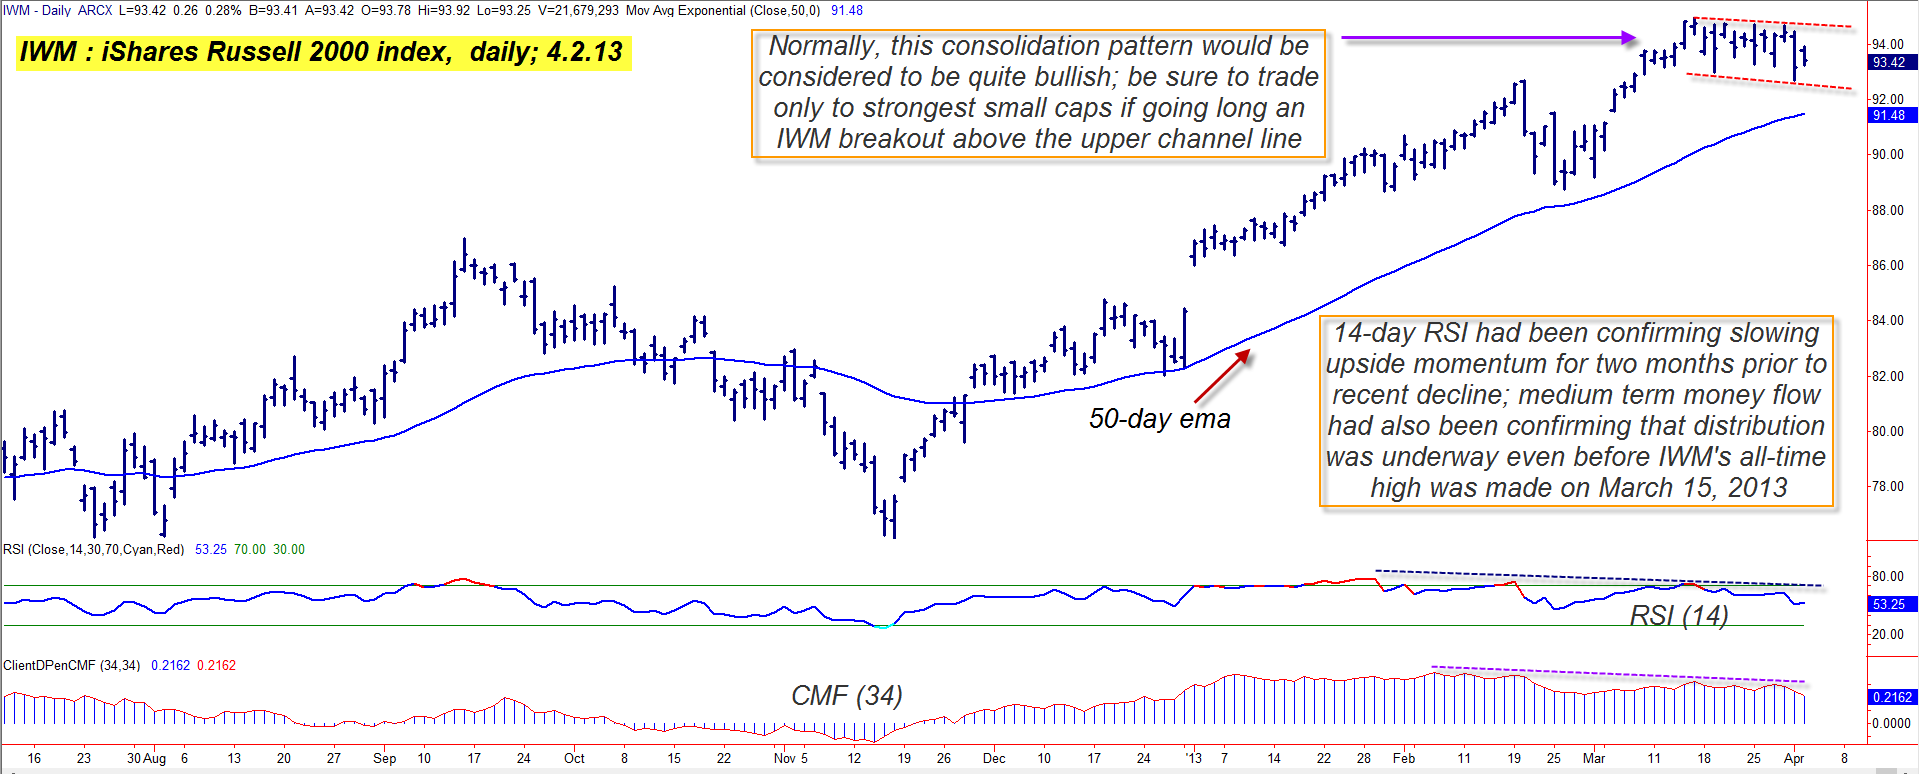
| Figure 2: IWM has already started the correction process; its current consolidation pattern could resolve with a breakout in either direction, but the odds might seem to favor an outcome toward the downside. |
| Graphic provided by: TradeStation. |
| |
| IWM's correction began about three weeks ago -- right after hitting its all-time high -- and a fairly bullish looking rectangle pattern has now manifested (Figure 2); it's too risky to trade anything but the strongest small caps on a break above IWM's upper resistance line, given just how far the bull market in small caps has traveled. Going short the weaker small cap stocks on a break below IWM's lower support line would appear to make a lot more sense at this current market juncture. Here's a brief checklist that may help traders stay on the right side of the broad markets in the days and weeks just ahead: 1. If already long the market, make sure that long-term positions are well-protected with fairly-priced put options. 2. Swing traders need to be more willing to take partial profits and/or set more modest profit targets for new long trades. 3. Since both IWM and SPY are in agreement that an important high has been made (or will soon be made), start shopping for fundamentally and technically weak stocks that you can short with an effective mechanical trading method, especially if you see IWM break down below the 92.71 level soon. |
| You can also choose to buy puts in an attempt to profit from a potential small cap stock trend reversal, one that could last for many months, with substantially lower prices for IWM ahead in late 2013. The weeks ahead will likely result in some explosive price moves in the broad US markets, so try to steer clear of trouble beforehand by limiting your exposure to the kind of stocks that may get hammered the most -- small caps. Trade wisely until we meet here again. |
Freelance financial markets writer and online publisher of the Trendzetterz.com S&P 500 Weekly Forecast service.
| Title: | Market consultant and writer |
| Company: | Trendzetterz |
| Address: | 81 Hickory Hollow Drive |
| Crossville, TN 38555 | |
| Phone # for sales: | 904-303-4814 |
| Website: | trendzetterz.com |
| E-mail address: | support@trendzetterz.com |
Traders' Resource Links | |
| Trendzetterz has not added any product or service information to TRADERS' RESOURCE. | |
Click here for more information about our publications!
Comments
Date:�04/03/13Rank:�5Comment:�Good Analysis

Request Information From Our Sponsors
- StockCharts.com, Inc.
- Candle Patterns
- Candlestick Charting Explained
- Intermarket Technical Analysis
- John Murphy on Chart Analysis
- John Murphy's Chart Pattern Recognition
- John Murphy's Market Message
- MurphyExplainsMarketAnalysis-Intermarket Analysis
- MurphyExplainsMarketAnalysis-Visual Analysis
- StockCharts.com
- Technical Analysis of the Financial Markets
- The Visual Investor
- VectorVest, Inc.
- Executive Premier Workshop
- One-Day Options Course
- OptionsPro
- Retirement Income Workshop
- Sure-Fire Trading Systems (VectorVest, Inc.)
- Trading as a Business Workshop
- VectorVest 7 EOD
- VectorVest 7 RealTime/IntraDay
- VectorVest AutoTester
- VectorVest Educational Services
- VectorVest OnLine
- VectorVest Options Analyzer
- VectorVest ProGraphics v6.0
- VectorVest ProTrader 7
- VectorVest RealTime Derby Tool
- VectorVest Simulator
- VectorVest Variator
- VectorVest Watchdog