HOT TOPICS LIST
- MACD
- Fibonacci
- RSI
- Gann
- ADXR
- Stochastics
- Volume
- Triangles
- Futures
- Cycles
- Volatility
- ZIGZAG
- MESA
- Retracement
- Aroon
INDICATORS LIST
LIST OF TOPICS
PRINT THIS ARTICLE
by Gary Grosschadl
Has the Dow crested a 100 year wave?
Position: N/A
Gary Grosschadl
Independent Canadian equities trader and technical analyst based in Peterborough
Ontario, Canada.
PRINT THIS ARTICLE
CHART ANALYSIS
A 100 Year Look At The Dow
08/16/02 10:51:07 AMby Gary Grosschadl
Has the Dow crested a 100 year wave?
Position: N/A
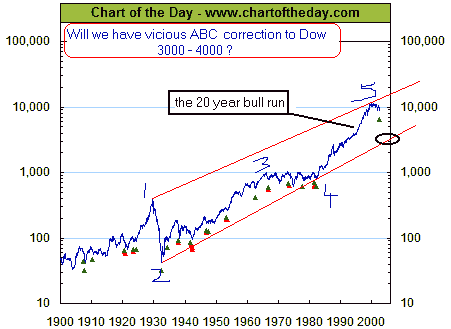
| Robert Prechter and other high profile bears have been super bearish. What if their long-term call is correct? We have all heard about this last 20-year bull run. So what happens after such a prolonged run? Will gravity pull the major indices down to long-term trendlines? We had an overreaction to the upside so a likewise move as the pendulum swings the other way is not really out of the question. The timing is up in the air, but stocks and indices tend to come down quicker after a bubble bursts. |
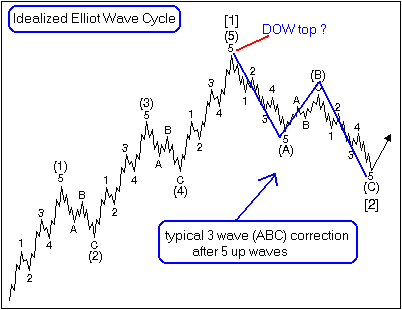
| After coming across this 100 year chart, I decided to throw some trendlines on it and also took a stab at labeling five up waves as many Elliotticians declare that we have finished five up waves. After five waves up, a three wave correction is said to follow. |

|
| Figure 1: The raw 100 year chart data is from chartoftheday.com, however all trendlines and comments are made by the author. |
| Graphic provided by: chartoftheday.com. |
| |
 Figure 2: An idealized Elliot wave cycle The second chart shows an idealized complete Elliott wave cycle. The challenge always is finding and agreeing just where we are in the grand scheme of things. If we don't exceed previous highs in the next 50 years then remember this chart. After all this is a long-term view. |
Independent Canadian equities trader and technical analyst based in Peterborough
Ontario, Canada.
| Website: | www.whatsonsale.ca/financial.html |
| E-mail address: | gwg7@sympatico.ca |
Click here for more information about our publications!
Comments
Date: 08/20/02Rank: 3Comment:
Date: 08/20/02Rank: 4Comment:
Date: 09/03/02Rank: 4Comment:

Request Information From Our Sponsors
- StockCharts.com, Inc.
- Candle Patterns
- Candlestick Charting Explained
- Intermarket Technical Analysis
- John Murphy on Chart Analysis
- John Murphy's Chart Pattern Recognition
- John Murphy's Market Message
- MurphyExplainsMarketAnalysis-Intermarket Analysis
- MurphyExplainsMarketAnalysis-Visual Analysis
- StockCharts.com
- Technical Analysis of the Financial Markets
- The Visual Investor
- VectorVest, Inc.
- Executive Premier Workshop
- One-Day Options Course
- OptionsPro
- Retirement Income Workshop
- Sure-Fire Trading Systems (VectorVest, Inc.)
- Trading as a Business Workshop
- VectorVest 7 EOD
- VectorVest 7 RealTime/IntraDay
- VectorVest AutoTester
- VectorVest Educational Services
- VectorVest OnLine
- VectorVest Options Analyzer
- VectorVest ProGraphics v6.0
- VectorVest ProTrader 7
- VectorVest RealTime Derby Tool
- VectorVest Simulator
- VectorVest Variator
- VectorVest Watchdog
