HOT TOPICS LIST
- MACD
- Fibonacci
- RSI
- Gann
- ADXR
- Stochastics
- Volume
- Triangles
- Futures
- Cycles
- Volatility
- ZIGZAG
- MESA
- Retracement
- Aroon
INDICATORS LIST
LIST OF TOPICS
PRINT THIS ARTICLE
by Koos van der Merwe
Cloud computing is becoming popular as a way to save data and make it available to the numerous computers, cell phones, and tablets you may have in your possession.
Position: Sell
Koos van der Merwe
Has been a technical analyst since 1969, and has worked as a futures and options trader with First Financial Futures in Johannesburg, South Africa.
PRINT THIS ARTICLE
HEAD & SHOULDERS
Looking At Cloud
04/02/13 04:27:13 PMby Koos van der Merwe
Cloud computing is becoming popular as a way to save data and make it available to the numerous computers, cell phones, and tablets you may have in your possession.
Position: Sell
| Cloud computing is one way to increase capacity or add capabilities on the fly without investing in new infrastructure, or licensing new software. Many who are not computer savvy still do not understand the advantages cloud computing offers, but as time passes, it is slowly becoming a part of daily computer technology. It is a beautiful way to sync your cell phone with your tablet. VM Ware, is one of the first companies that offered cloud computing to the public. As more companies came into the market, the share price was affected, but are they becoming more competitive? Is this a share that you should now add to your portfolio? |

|
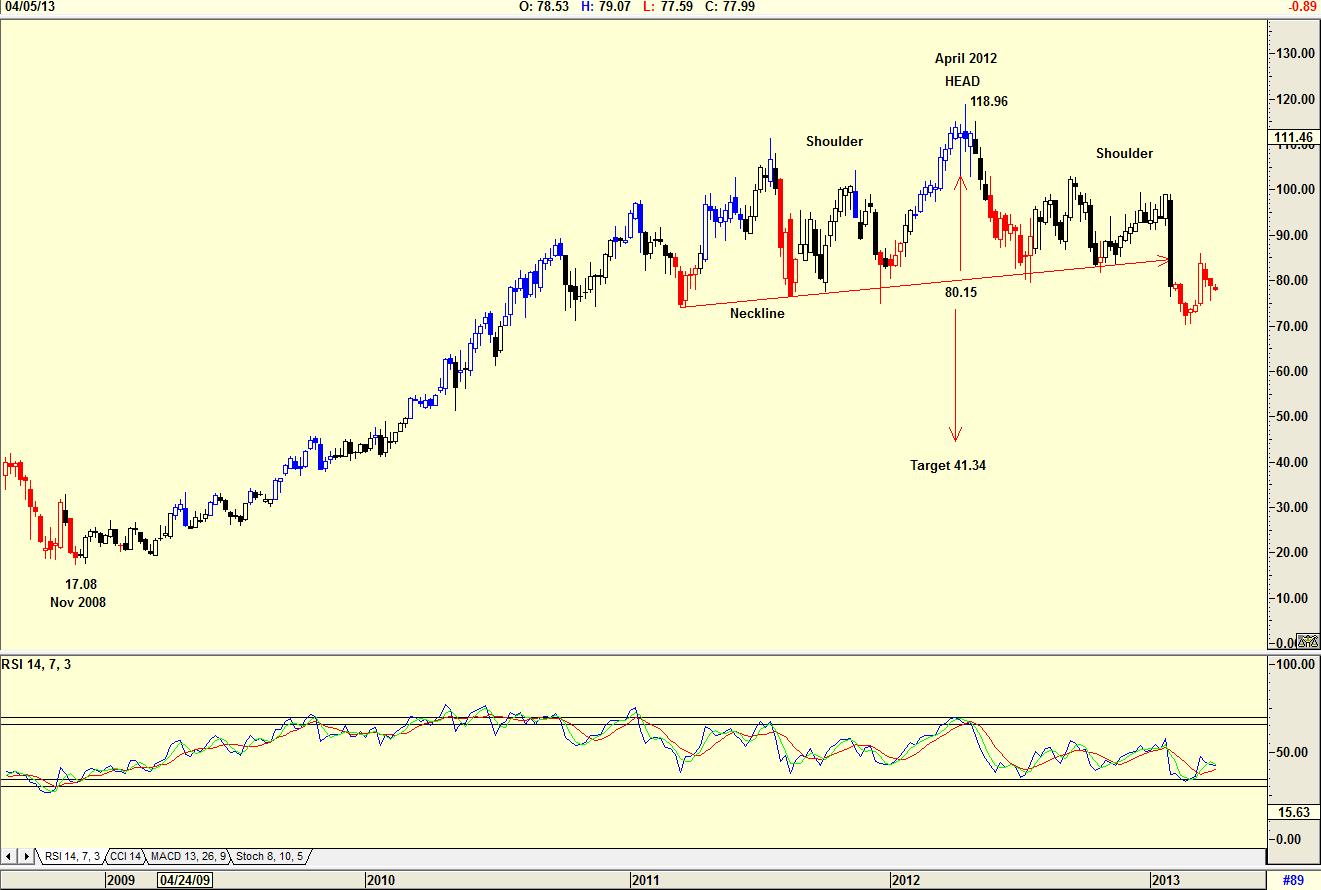
| Figure 1: Weekly chart of VMW showing a head & shoulders pattern. |
| Graphic provided by: AdvancedGET. |
| |
| The weekly chart in Figure 1 of VMW shows how price rose from a low of $17.08 in November 2008 to a high of $118.96 by April 2012. The pattern that has formed at the high is a head & shoulder pattern suggesting a target of $41.34. (118.96 - 81.15 = 37.81. 80.15-37.81=41.34). The RSI indicator is suggesting a possible buy at present levels, but this has to be confirmed. With the current price at $77.99, there is still a great deal of downside to the target $41.34. The weekly chart is not suggesting a buy. |

|
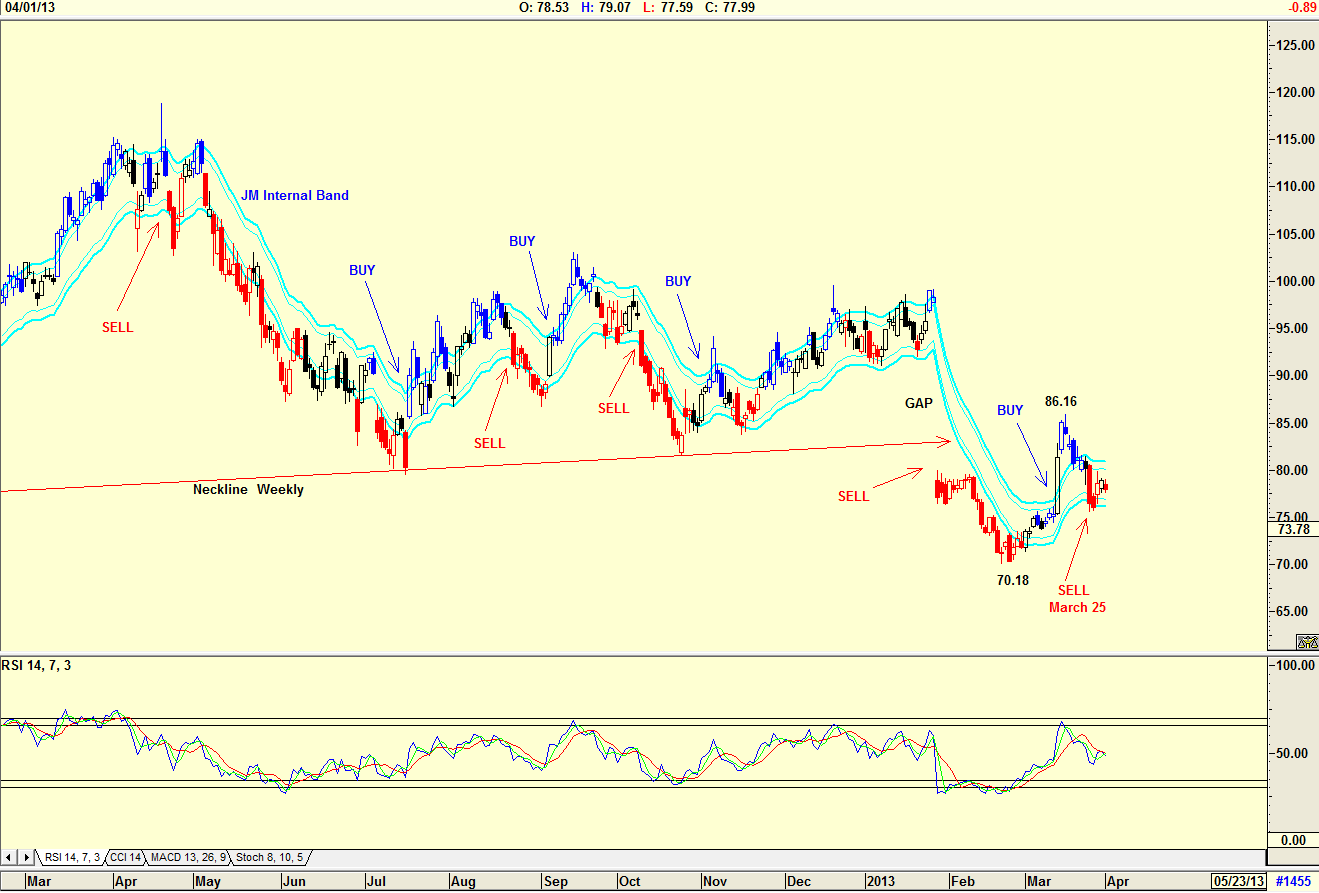
| Figure 2: Daily chart of VMW showing IM Internal band sell signal. |
| Graphic provided by: AdvancedGET. |
| |
| The daily chart in Figure 2 shows the neckline from the weekly chart and the formation of a gap as the price broke below the neckline. The price, as expected, rose to fill the gap, and started falling again. The chart shows the buy/sell signals given by the JM internal band indicator. The JM internal band is a 15-period simple moving average (SMA) offset by 2% positive and 2% negative. A break above the upper band signals a buy and a break below the lower band signals a sell. The sell signal given on March 25, 2013 is confirmed by the RSI indicator which is trending down. The different colors of the candlesticks on the chart shows the following. 1. If the bars are blue, then the trend is up. 2. If they are red then the trend is down. 3. If they are black then it is neutral, and you will have to wait to see how the next breakout will occur. At present, the bars are red on the weekly and daily charts, suggesting a negative scenario. I would not be a buyer of VMWare at the moment. I would wait for a JM Internal band buy signal, and then re-evaluate the share. |
Has been a technical analyst since 1969, and has worked as a futures and options trader with First Financial Futures in Johannesburg, South Africa.
| Address: | 3256 West 24th Ave |
| Vancouver, BC | |
| Phone # for sales: | 6042634214 |
| E-mail address: | petroosp@gmail.com |
Click here for more information about our publications!
Comments

Request Information From Our Sponsors
- StockCharts.com, Inc.
- Candle Patterns
- Candlestick Charting Explained
- Intermarket Technical Analysis
- John Murphy on Chart Analysis
- John Murphy's Chart Pattern Recognition
- John Murphy's Market Message
- MurphyExplainsMarketAnalysis-Intermarket Analysis
- MurphyExplainsMarketAnalysis-Visual Analysis
- StockCharts.com
- Technical Analysis of the Financial Markets
- The Visual Investor
- VectorVest, Inc.
- Executive Premier Workshop
- One-Day Options Course
- OptionsPro
- Retirement Income Workshop
- Sure-Fire Trading Systems (VectorVest, Inc.)
- Trading as a Business Workshop
- VectorVest 7 EOD
- VectorVest 7 RealTime/IntraDay
- VectorVest AutoTester
- VectorVest Educational Services
- VectorVest OnLine
- VectorVest Options Analyzer
- VectorVest ProGraphics v6.0
- VectorVest ProTrader 7
- VectorVest RealTime Derby Tool
- VectorVest Simulator
- VectorVest Variator
- VectorVest Watchdog
