

HOT TOPICS LIST
- MACD
- Fibonacci
- RSI
- Gann
- ADXR
- Stochastics
- Volume
- Triangles
- Futures
- Cycles
- Volatility
- ZIGZAG
- MESA
- Retracement
- Aroon
INDICATORS LIST
LIST OF TOPICS
PRINT THIS ARTICLE
by Donald W. Pendergast, Jr.
When a fundamentally attractive stock rallies strongly on a day when the broad markets are tumbling, traders and investors should take notice.
Position: N/A
Donald W. Pendergast, Jr.
Freelance financial markets writer and online publisher of the Trendzetterz.com S&P 500 Weekly Forecast service.
PRINT THIS ARTICLE
APO: Bucking The Tide In A Sea Of Red
04/02/13 04:22:15 PMby Donald W. Pendergast, Jr.
When a fundamentally attractive stock rallies strongly on a day when the broad markets are tumbling, traders and investors should take notice.
Position: N/A
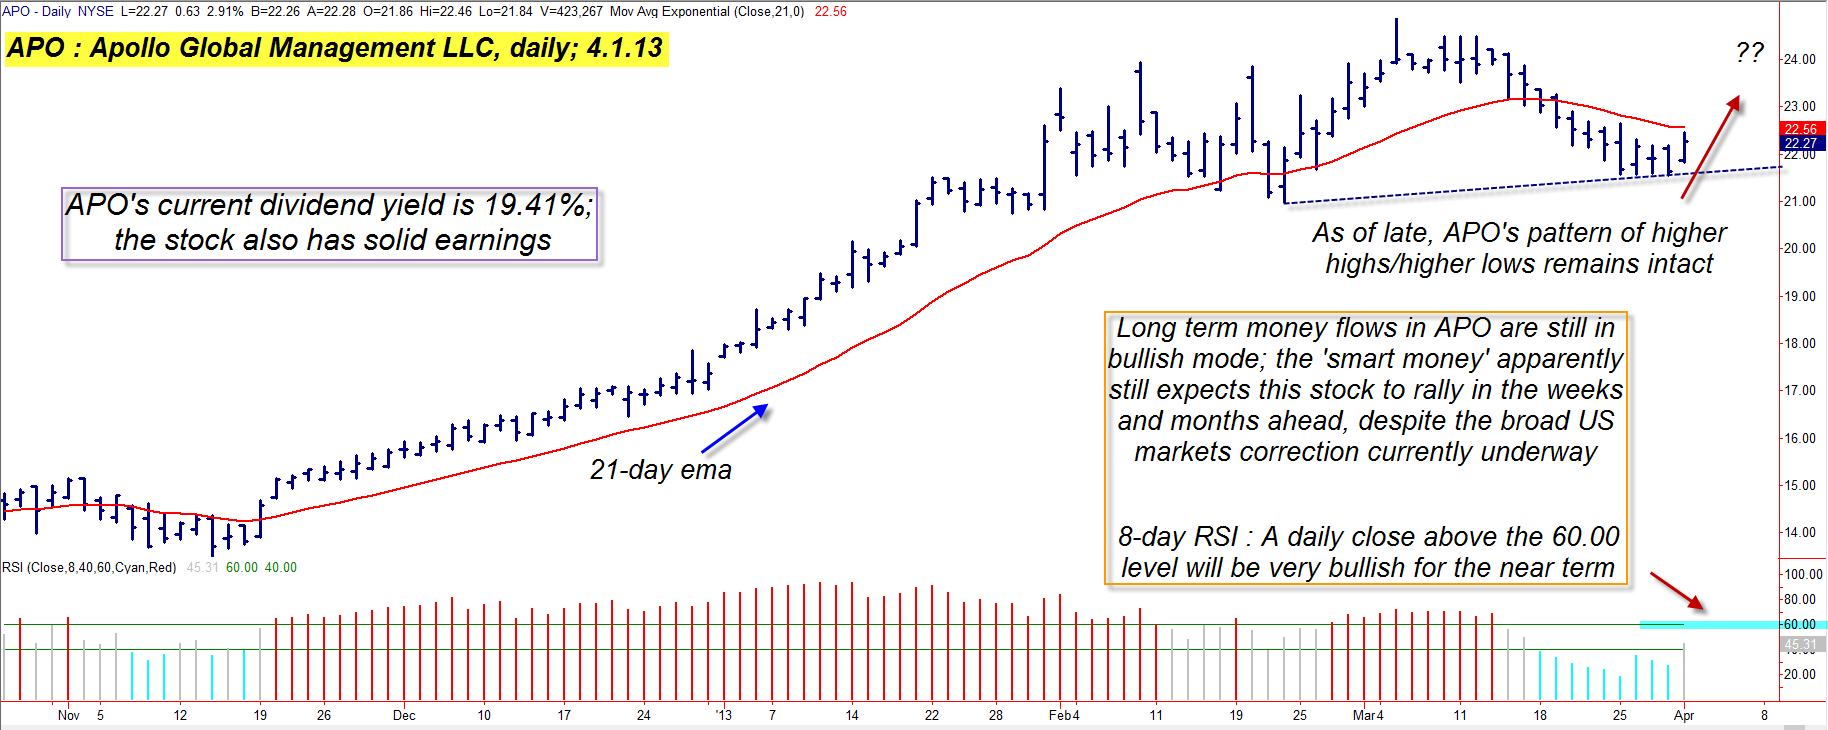
| April fool's day, 2013 saw the broad US markets sell off sharply; whether this is the beginning of a highly anticipated, proportional correction or not, the selling pressure has been extending its reach into all stock market sectors. There are, however, pockets of market strength, and one stock that still looks attractive on both fundamental and technical measures is Apollo Global Management LLC (APO); the stock is up by better than 2.75% on a day when the Russell 2000 index (.RUT) is down by about 1.50%. Let's take a look at its daily chart (Figure 1) to see why institutions are still plowing money into this particular financial sector issue. |
|
| Figure 1: A stock that can manage a strong daily gain on a day when most others are tanking is definitely a cause for further investigation; APO looks like it will soon be offering a low-risk long swing trade entry. |
| Graphic provided by: TradeStation. |
| |
| Since making a major multicycle low on May 21, 2012, APO has enjoyed a fairly smooth and steady uptrend; rising all the way from 10.09 to 24.87 on March 5, 2013, before putting in its most recent correction. APO offers an exceptionally generous dividend yield (currently more than 19% per annum) and so it's not hard to understand why pro money managers continued to build positions in the stock during that rally. Now, however, APO is off of those March highs, has put in a slightly angled double bottom pattern and is now starting to break higher once again. Again, the quest for strong dividend yields is likely to be the primary reason for APO's new-found strength, but that its daily chart pattern is so bullish — with a clear shot for another run at 24.87 — has also got to be an attraction, inviting traders to step in and put some money to work in this stock. Long-term money flow remains above its zero line, yet another clue that the "smart money" still views APO's latest pullback as a legitimate, low-risk buying opportunity. The stock is now trading just below its 21-day exponential moving average (red line), and if we see the eight-day RSI histogram produce a bar that closes at a level of 60.00 or higher, a true breakout buy signal will be generated. If the broad markets rally in the later part of this week, that might be the time to be on the lookout for this to occur — along with a daily close above the 21-day exponential moving average (EMA). |
|
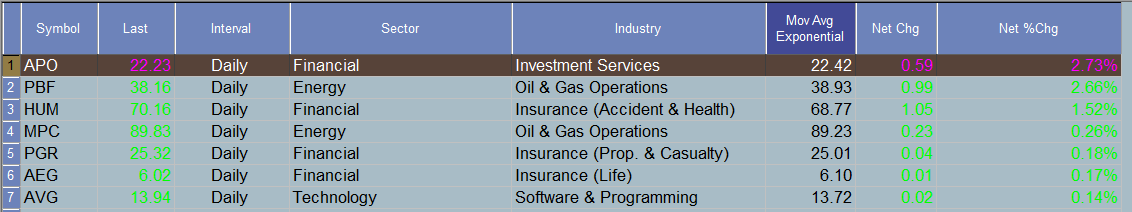
| Figure 2: APO is one of a small percentage of US stocks posting sizable gains on April 1, 2013. |
| Graphic provided by: TradeStation. |
| Graphic provided by: TradeStation Radar Screen. |
| |
| Call options in APO have a wide bid-ask spread, making them less than desirable for covered call aficionados; the wisest course of action in APO at this juncture appears to be a simple swing trade, set up something like this: 1. Place a buy stop market order at 22.50. 2. If filled, start running a three-bar trailing stop of APO's daily lows. 3. Should the trade rally quickly towards the 24.50 area, consider taking at least partial profits and tightening the trailing stop to a two-bar variety. More conservative traders might want to cash out the entire trade near 24.50; they should also limit their account risk to no more than 1% on this trade due to the bearish broad market conditions in which this trade must attempt to thrive. Trading against the dominant current in the broad markets is not for the novice or faint of heart, but for the experienced trader who can spot a legit swing trade setup, this one looks pretty good right now. Trade wisely until we meet here again. |
Freelance financial markets writer and online publisher of the Trendzetterz.com S&P 500 Weekly Forecast service.
| Title: | Market consultant and writer |
| Company: | Trendzetterz |
| Address: | 81 Hickory Hollow Drive |
| Crossville, TN 38555 | |
| Phone # for sales: | 904-303-4814 |
| Website: | trendzetterz.com |
| E-mail address: | support@trendzetterz.com |
Traders' Resource Links | |
| Trendzetterz has not added any product or service information to TRADERS' RESOURCE. | |
Click here for more information about our publications!
PRINT THIS ARTICLE

Request Information From Our Sponsors
- StockCharts.com, Inc.
- Candle Patterns
- Candlestick Charting Explained
- Intermarket Technical Analysis
- John Murphy on Chart Analysis
- John Murphy's Chart Pattern Recognition
- John Murphy's Market Message
- MurphyExplainsMarketAnalysis-Intermarket Analysis
- MurphyExplainsMarketAnalysis-Visual Analysis
- StockCharts.com
- Technical Analysis of the Financial Markets
- The Visual Investor
- VectorVest, Inc.
- Executive Premier Workshop
- One-Day Options Course
- OptionsPro
- Retirement Income Workshop
- Sure-Fire Trading Systems (VectorVest, Inc.)
- Trading as a Business Workshop
- VectorVest 7 EOD
- VectorVest 7 RealTime/IntraDay
- VectorVest AutoTester
- VectorVest Educational Services
- VectorVest OnLine
- VectorVest Options Analyzer
- VectorVest ProGraphics v6.0
- VectorVest ProTrader 7
- VectorVest RealTime Derby Tool
- VectorVest Simulator
- VectorVest Variator
- VectorVest Watchdog