HOT TOPICS LIST
- MACD
- Fibonacci
- RSI
- Gann
- ADXR
- Stochastics
- Volume
- Triangles
- Futures
- Cycles
- Volatility
- ZIGZAG
- MESA
- Retracement
- Aroon
INDICATORS LIST
LIST OF TOPICS
PRINT THIS ARTICLE
by Matt Blackman
The year 2012 was the toughest year ever for DECK, even worse than 2008. But lately, the chart is looking downright bullish. Could this be the company's best year ever?
Position: Buy
Matt Blackman
Matt Blackman is a full-time technical and financial writer and trader. He produces corporate and financial newsletters, and assists clients in getting published in the mainstream media. He is the host of TradeSystemGuru.com. Matt has earned the Chartered Market Technician (CMT) designation. Find out what stocks and futures Matt is watching on Twitter at www.twitter.com/RatioTrade
PRINT THIS ARTICLE
FIBONACCI
Decker Outdoor On Track For Its Best Annual Performance Ever
03/29/13 03:18:05 PMby Matt Blackman
The year 2012 was the toughest year ever for DECK, even worse than 2008. But lately, the chart is looking downright bullish. Could this be the company's best year ever?
Position: Buy
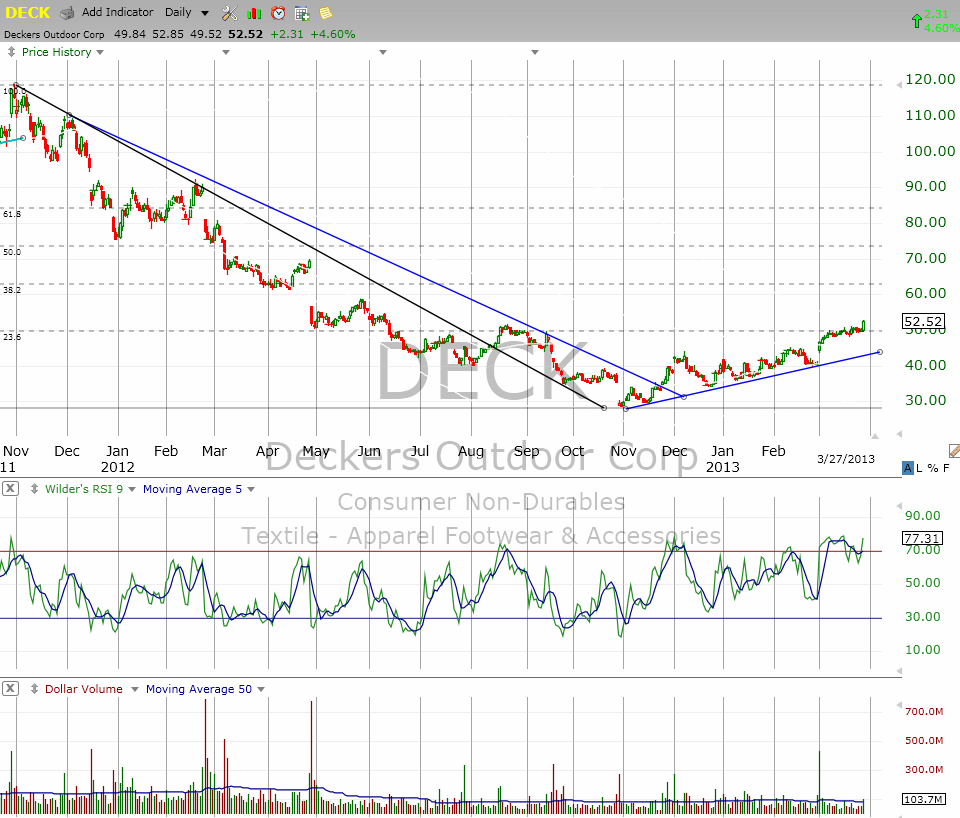
| Between November 1, 2011 and October 31, 2012, outdoor footwear and apparel designer Decker Outdoor Corporation (DECK) lost 74% dropping from a high of $110.84 to a close of $28.63 on Halloween day. But the goblins and ghouls seemed to have a cleaning effect on the stock and since then it hasn't looked back. |
| Part of the upside can be attributed to the Textile and Apparel Footwear industry which has experienced a renaissance of sorts after an abysmal year in 2012. But what is perhaps most exciting about DECK is how this year is shaping up when compared to all others since it first began trading publicly. |

|
| Figure 1 – After a tough preceding 12 months, DECK bottomed October 31 at $28.63 and by the end of March 2013 had since added more than 80% to its stock price and in the process blew past its 23.6% Fibonacci retracement level. Next major resistance is the 38.2 level at around $63. |
| Graphic provided by: TC2000.com. |
| |
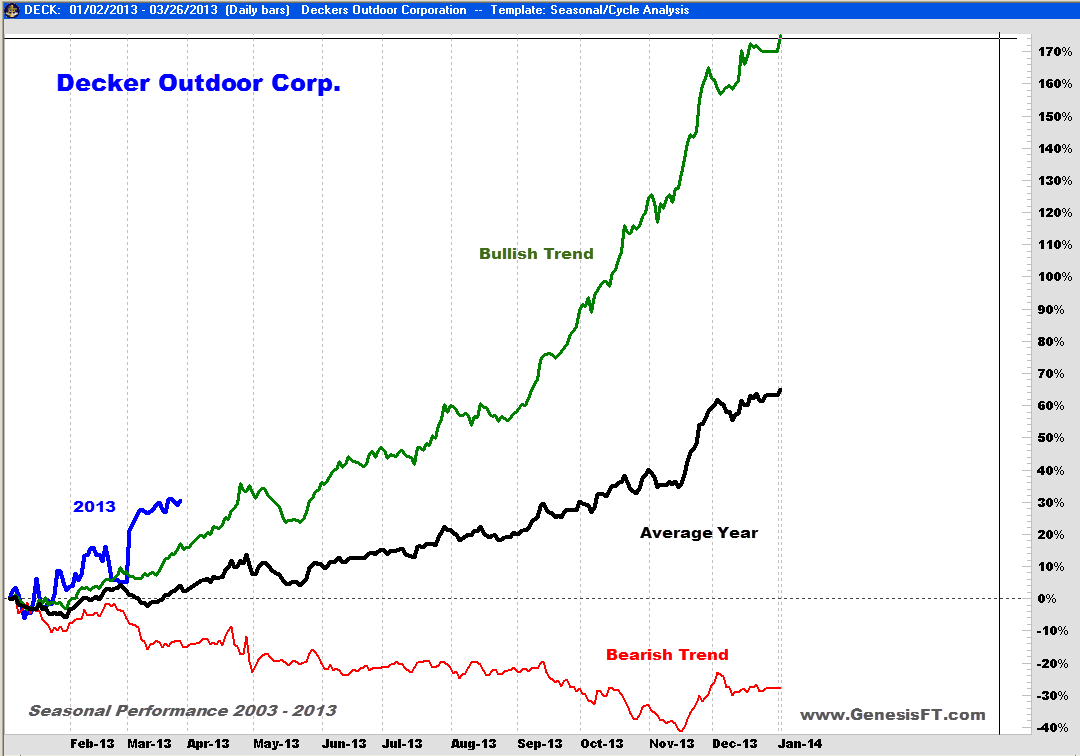
| As the next figure shows, DECK is on track for its best year ever, well ahead of the average of its bullish years and well ahead of the average year. The only question remains, is can it keep up this pace? On average (see black line in Figure 2), DECK hasn't done that well in Q1, experiences better growth in April, a down May and then solid growth through Q3. Clearly sales take off right after Black Friday through year-end which is by far the best time to be in the stock even in bearish years (see red line). |

|
| Figure 2 – Seasonal chart for Decker Outdoor Corp. showing bullish, average and bearish years since it began trading in 2003 with 2013 in the lead. Note the uncharacteristically strong March in 2013. |
| Graphic provided by: Trade Navigator www.GenesisFT.com. |
| |
| The year 2013 is a clear standout with March having experienced exceptionally strong albeit unusual stock price gains helped by a gap up on March 1. This has all the makings of institutional accumulation which means the smart money appears to believe that this stock was unfairly punished in 2012. |
| From a support/resistance point of view, note that DECK blew through the Fibonacci 23.6% retracement resistance at $50. And the next major resistance and Fib 38.2 level is just above $60. If this market continues to shrug off European and fiscal cliff concerns, and if seasonal factors play out as they have in the past, there is a fighting chance that DECK will be sitting north of $60 by the end of April. But for channel traders like me, buying near the top channel is less than desirable but given the recent strength of this stock, we may not get a chance to buy it on any sizable retracement before it hits $60. |
Matt Blackman is a full-time technical and financial writer and trader. He produces corporate and financial newsletters, and assists clients in getting published in the mainstream media. He is the host of TradeSystemGuru.com. Matt has earned the Chartered Market Technician (CMT) designation. Find out what stocks and futures Matt is watching on Twitter at www.twitter.com/RatioTrade
| Company: | TradeSystemGuru.com |
| Address: | Box 2589 |
| Garibaldi Highlands, BC Canada | |
| Phone # for sales: | 604-898-9069 |
| Fax: | 604-898-9069 |
| Website: | www.tradesystemguru.com |
| E-mail address: | indextradermb@gmail.com |
Traders' Resource Links | |
| TradeSystemGuru.com has not added any product or service information to TRADERS' RESOURCE. | |
Click here for more information about our publications!
Comments

|

Request Information From Our Sponsors
- StockCharts.com, Inc.
- Candle Patterns
- Candlestick Charting Explained
- Intermarket Technical Analysis
- John Murphy on Chart Analysis
- John Murphy's Chart Pattern Recognition
- John Murphy's Market Message
- MurphyExplainsMarketAnalysis-Intermarket Analysis
- MurphyExplainsMarketAnalysis-Visual Analysis
- StockCharts.com
- Technical Analysis of the Financial Markets
- The Visual Investor
- VectorVest, Inc.
- Executive Premier Workshop
- One-Day Options Course
- OptionsPro
- Retirement Income Workshop
- Sure-Fire Trading Systems (VectorVest, Inc.)
- Trading as a Business Workshop
- VectorVest 7 EOD
- VectorVest 7 RealTime/IntraDay
- VectorVest AutoTester
- VectorVest Educational Services
- VectorVest OnLine
- VectorVest Options Analyzer
- VectorVest ProGraphics v6.0
- VectorVest ProTrader 7
- VectorVest RealTime Derby Tool
- VectorVest Simulator
- VectorVest Variator
- VectorVest Watchdog
