

HOT TOPICS LIST
- MACD
- Fibonacci
- RSI
- Gann
- ADXR
- Stochastics
- Volume
- Triangles
- Futures
- Cycles
- Volatility
- ZIGZAG
- MESA
- Retracement
- Aroon
INDICATORS LIST
LIST OF TOPICS
PRINT THIS ARTICLE
by Donald W. Pendergast, Jr.
When a stock is leading the market higher on a given day, scanning for intraday swing trade setups may uncover additional opportunities.
Position: N/A
Donald W. Pendergast, Jr.
Freelance financial markets writer and online publisher of the Trendzetterz.com S&P 500 Weekly Forecast service.
PRINT THIS ARTICLE
TECHNICAL INDICATORS
Scanning For Swing Trade Setups
03/29/13 03:11:29 PMby Donald W. Pendergast, Jr.
When a stock is leading the market higher on a given day, scanning for intraday swing trade setups may uncover additional opportunities.
Position: N/A
| Many traders like to keep real-time tabs on the intraday action in the US stock market; TradeStation's RadarScreen application is up to the task, regardless of how simple or complex a given set of scanning criteria are. In this article I'll look at a practical method that swing traders can use to help find promising breakout buy/sell setups in stocks manifesting bullish (or bearish) intraday price action. While this method can't promise wealth or instant profitability or even long-term wealth, it can at the very least, help simplify and focus your stock screening process, assuming that you even have one in the first place. Here's a more detailed look now. |
|
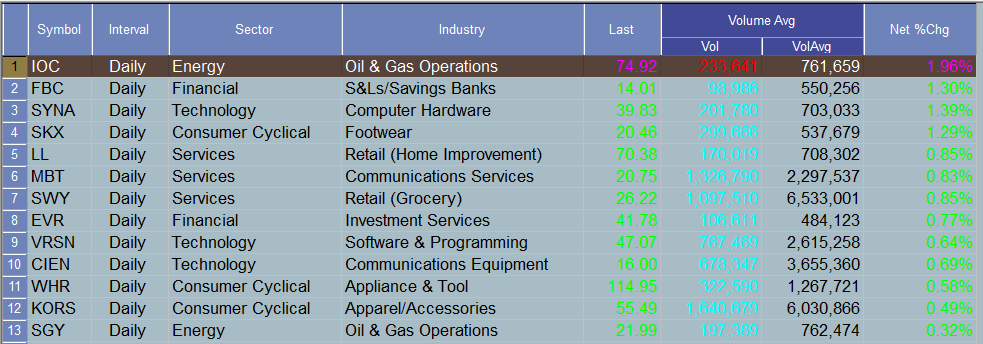
| Figure 1: All of the above stocks were showing intraday gains at a time when all of the broad US stock indexes were all in the red. Even in a down market, institutions are still buying into long term stock positions. |
| Graphic provided by: TradeStation. |
| Graphic provided by: TradeStation Radar Screen. |
| |
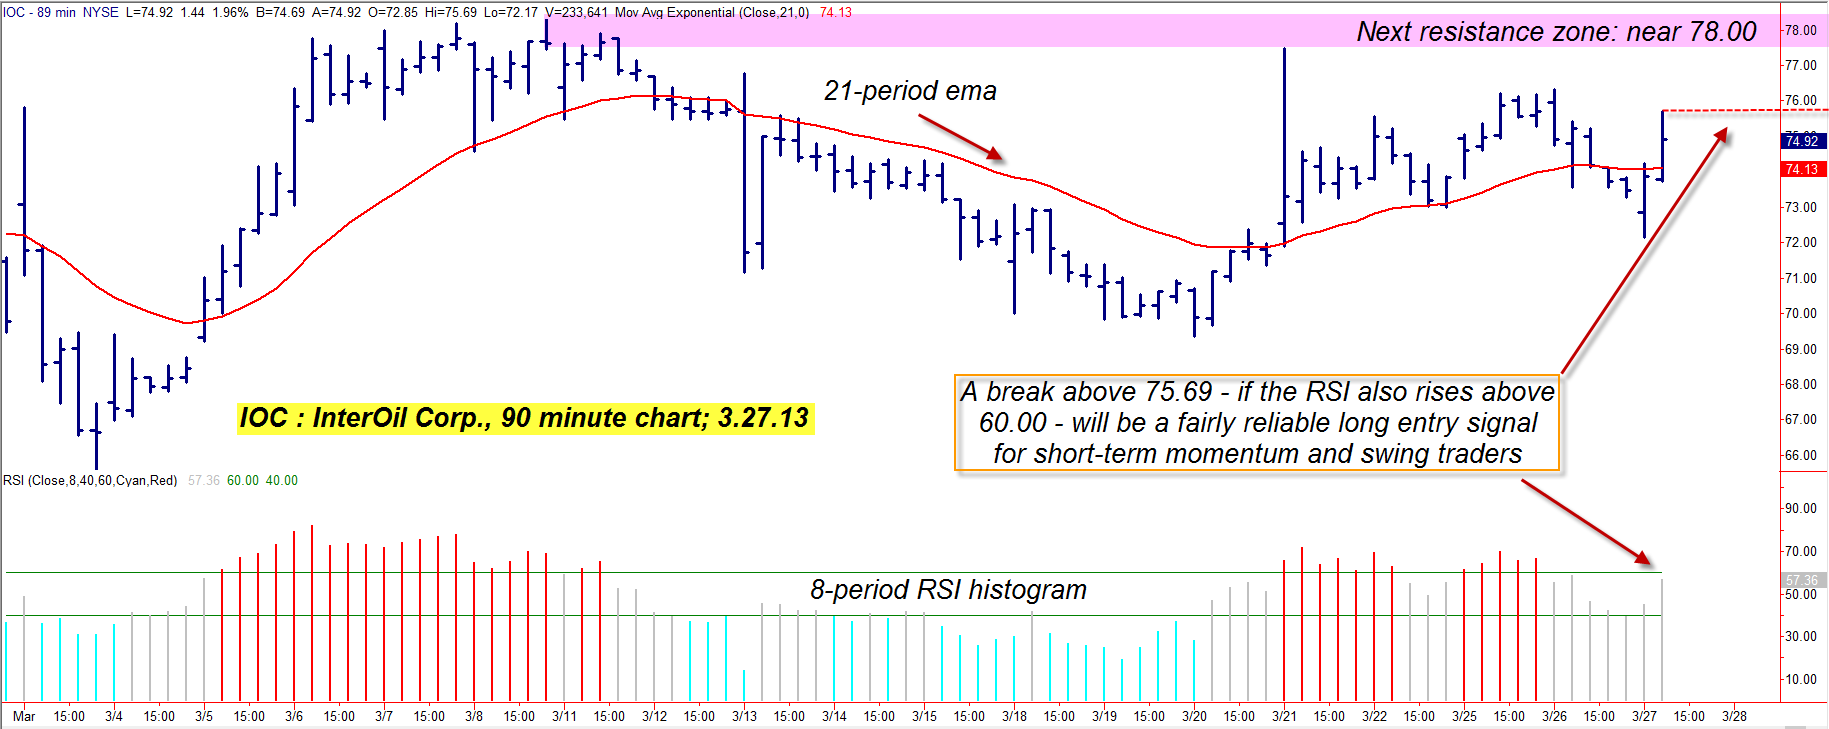
| During the morning trading session of March 27, 2013, while the broad markets were all noticeably down, some stocks were actually rising in value, bucking the bearish tide. You can see a dozen of them in the table in Figure 1 - most of these stocks had decent long-term fundamentals and/or technical chart patterns - and the best performing stock of the day (at that point) was InterOil Corp. (IOC). It was up nearly 2% even while the Russell 2000 index (.RUT) was off by nearly .5% and the .SPX (S&P 500 index) was also underwater; pulling up IOC on a 90-minute chart (Figure 2) - which can be a very good time frame for swing traders to focus on as strong one to four day price swings develop - revealed that the stock was: 1. Trading within a range. 2. Had just closed above its 21-period EMA (red line). 3. Was very likely to trigger an eight-period RSI breakout above the 60.00 level - once 75.69 was eventually exceeded. As of this writing this prospective long trade has not yet triggered, so it simply goes on a watch list until such time as it does - assuming that IOC still has enough upward momentum to get the job done in time. A truly dedicated/motivated trader would also be checking out the 90-minute chart patterns (using the same basic template) of all the other stocks on the RadarScreen window that were also showing gains on the session. |
|
| Figure 2: Shares of InterOil can and do make tradable swing moves from time to time; notice how well the 21-period EMA works with the 8-period RSI to confirm breaks above/below 60/40 on the RSI. |
| Graphic provided by: TradeStation. |
| |
| If IOC does trigger a long entry at around 75.70, what then? Since IOC has a decent track record of making strong swing moves, it might pay to manage the trade like this: 1. Run a two- to three-bar trailing stop based on the 90-minute bar lows. 2. Consider taking half profits on a rise toward the 77.50 to 78.00 area, which happens to be the next strong intraday resistance level in IOC. 3. Be sure to keep your account risk on this swing trade at around .5 to .75% of your account equity. Any other swing trades located with this basic method can also be managed in the same way (use a trailing stop based on the 90-minute bar highs for short trades, of course); don't overlook the importance of taking partial profits, particularly near key support/resistance levels (SR) that you've already identified, as this will help you minimize losses on trades that get turned back at a strong SR level even as it helps boost your winning percentage (and confidence level). Trade setups like these aren't always winners, but that you've used a rational technique to locate each one (based on solid fundamentals and non-optimized momentum/technical criteria), should help you to learn to trade these with a high level of confidence over time. Trade wisely until we meet here again. |
Freelance financial markets writer and online publisher of the Trendzetterz.com S&P 500 Weekly Forecast service.
| Title: | Market consultant and writer |
| Company: | Trendzetterz |
| Address: | 81 Hickory Hollow Drive |
| Crossville, TN 38555 | |
| Phone # for sales: | 904-303-4814 |
| Website: | trendzetterz.com |
| E-mail address: | support@trendzetterz.com |
Traders' Resource Links | |
| Trendzetterz has not added any product or service information to TRADERS' RESOURCE. | |
Click here for more information about our publications!
Comments

Request Information From Our Sponsors
- StockCharts.com, Inc.
- Candle Patterns
- Candlestick Charting Explained
- Intermarket Technical Analysis
- John Murphy on Chart Analysis
- John Murphy's Chart Pattern Recognition
- John Murphy's Market Message
- MurphyExplainsMarketAnalysis-Intermarket Analysis
- MurphyExplainsMarketAnalysis-Visual Analysis
- StockCharts.com
- Technical Analysis of the Financial Markets
- The Visual Investor
- VectorVest, Inc.
- Executive Premier Workshop
- One-Day Options Course
- OptionsPro
- Retirement Income Workshop
- Sure-Fire Trading Systems (VectorVest, Inc.)
- Trading as a Business Workshop
- VectorVest 7 EOD
- VectorVest 7 RealTime/IntraDay
- VectorVest AutoTester
- VectorVest Educational Services
- VectorVest OnLine
- VectorVest Options Analyzer
- VectorVest ProGraphics v6.0
- VectorVest ProTrader 7
- VectorVest RealTime Derby Tool
- VectorVest Simulator
- VectorVest Variator
- VectorVest Watchdog