

HOT TOPICS LIST
- MACD
- Fibonacci
- RSI
- Gann
- ADXR
- Stochastics
- Volume
- Triangles
- Futures
- Cycles
- Volatility
- ZIGZAG
- MESA
- Retracement
- Aroon
INDICATORS LIST
LIST OF TOPICS
PRINT THIS ARTICLE
by Alan R. Northam
While Blackberry remains in a long-term upward trend, an intermediate-term statistical analysis shows that Blackberry is ready to give back some of its recent gains.
Position: N/A
Alan R. Northam
Alan Northam lives in the Dallas, Texas area and as an electronic engineer gave him an analytical mind from which he has developed a thorough knowledge of stock market technical analysis. His abilities to analyze the future direction of the stock market has allowed him to successfully trade of his own portfolio over the last 30 years. Mr. Northam is now retired and trading the stock market full time. You can reach him at inquiry@tradersclassroom.com or by visiting his website at http://www.tradersclassroom.com. You can also follow him on Twitter @TradersClassrm.
PRINT THIS ARTICLE
STATISTICS
Blackberry - Giving Back
03/28/13 02:50:45 PMby Alan R. Northam
While Blackberry remains in a long-term upward trend, an intermediate-term statistical analysis shows that Blackberry is ready to give back some of its recent gains.
Position: N/A
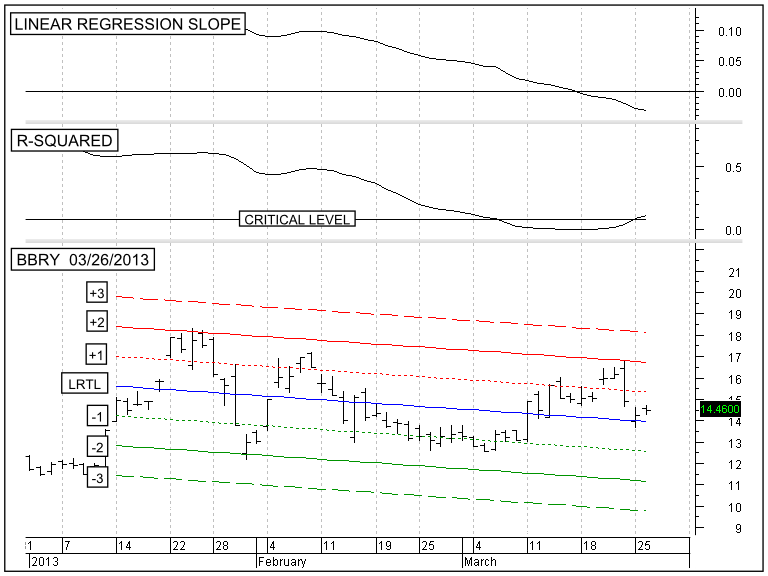
| The long-term upward trend for Blackberry remains bullish. Over the shorter-term, however, it looks as if Blackberry (BBRY) is ready to give up some of its recent gains. Here is my intermediate-term statistical analysis of BBRY: Figure 1 shows the daily price bars of BBRY in the bottom window. The top window shows the linear regression slope indicator and the middle window the R-Squared indicator. |
|
| FIGURE 1: BBRY, DAILY. This chart shows the daily price chart BBRY, in the lower window along with its 50-day linear regression trend line and its associate channel lines. The top window shows the linear regression slope indicator followed by the R-squared indicator in the next lower window. |
| Graphic provided by: MetaStock. |
| |
| The 50-day linear regression slope indicator in the top window is below its zero line indicating that the intermediate-term trend of BBRY is in the downward direction. This indicator also continues to point in a downward direction indicating that price has further to go on the downside. |
| The 50-day R-Squared indicator in the middle window shows that it has moved above its critical level indicating a statistically significant upward trend in play. By 'statistically significant' it is meant that statistically there is a 95% confidence level that the current intermediate-term downward trend will continue. |
| The bottom window shows the daily price bars of BBRY. This window also shows the 50-day linear regression trend line (blue line) along with the upper 1 sigma channel line (red dotted line), the upper 2 sigma channel line (solid red line), the lower 1 sigma channel (green dotted line), the lower 2 sigma channel line (solid green line), and the lower 3 sigma channel line (dashed green line). The red channel lines represent resistance lines and the green channel lines represent support. Notice that price has been trading between the +2 and the -2 sigma channel lines over the past 50 trading sessions. When price trades between these limits it is an indication of volatility. Volatility normally occurs around the turning points when a trend changes from an upward trend to a downward trend and visa versa. In the case of BBRY the trend has already turned from an up trend to a down trend but since volatility continues, it is an indication that the newly established intermediate-term downward trend is still in its infancy. As the downward trend continues to develop we should see the linear regression line and its associated channel lines continue to steepen in the downward direction and price should start trading between the +1 and -1 sigma channel lines, which would then be an indication of a strong downward trend. |
| In conclusion, the 50-day linear regression slope indicator has moved below its zero line to indicate that BBRY has entered into an intermediate-term downward trend. The 50-day linear regression trend line and its associated channel lines are also sloping downward confirming the downward trend. The R-squared indicator has moved above its critical level indicating that there is statistically a 95% confidence level that the downward trend will continue. The question is "How far should we expect price to fall?" Well, if the long-term trend continues upward then there are two lower support levels. The first support level is currently at $11.60 and the second is at $8.40 (the -1 and -2 sigma channel lines of the 200-day linear regression trend line). However, keep in mind that these support levels continue to increase at a rate of 22 cents per week. If, on the other hand, the long-term trend of BBRY is to reverse back downward then price will most likely fall through these support levels. |
Alan Northam lives in the Dallas, Texas area and as an electronic engineer gave him an analytical mind from which he has developed a thorough knowledge of stock market technical analysis. His abilities to analyze the future direction of the stock market has allowed him to successfully trade of his own portfolio over the last 30 years. Mr. Northam is now retired and trading the stock market full time. You can reach him at inquiry@tradersclassroom.com or by visiting his website at http://www.tradersclassroom.com. You can also follow him on Twitter @TradersClassrm.
| Garland, Tx | |
| Website: | www.tradersclassroom.com |
| E-mail address: | inquiry@tradersclassroom.com |
Click here for more information about our publications!
PRINT THIS ARTICLE

Request Information From Our Sponsors
- VectorVest, Inc.
- Executive Premier Workshop
- One-Day Options Course
- OptionsPro
- Retirement Income Workshop
- Sure-Fire Trading Systems (VectorVest, Inc.)
- Trading as a Business Workshop
- VectorVest 7 EOD
- VectorVest 7 RealTime/IntraDay
- VectorVest AutoTester
- VectorVest Educational Services
- VectorVest OnLine
- VectorVest Options Analyzer
- VectorVest ProGraphics v6.0
- VectorVest ProTrader 7
- VectorVest RealTime Derby Tool
- VectorVest Simulator
- VectorVest Variator
- VectorVest Watchdog
- StockCharts.com, Inc.
- Candle Patterns
- Candlestick Charting Explained
- Intermarket Technical Analysis
- John Murphy on Chart Analysis
- John Murphy's Chart Pattern Recognition
- John Murphy's Market Message
- MurphyExplainsMarketAnalysis-Intermarket Analysis
- MurphyExplainsMarketAnalysis-Visual Analysis
- StockCharts.com
- Technical Analysis of the Financial Markets
- The Visual Investor