HOT TOPICS LIST
- MACD
- Fibonacci
- RSI
- Gann
- ADXR
- Stochastics
- Volume
- Triangles
- Futures
- Cycles
- Volatility
- ZIGZAG
- MESA
- Retracement
- Aroon
INDICATORS LIST
LIST OF TOPICS
PRINT THIS ARTICLE
by David Penn
A July diamond anticipates sizable moves in the commodities index. Will grains continue to gain?
Position: N/A
David Penn
Technical Writer for Technical Analysis of STOCKS & COMMODITIES magazine, Working-Money.com, and Traders.com Advantage.
PRINT THIS ARTICLE
FUTURES
Diamonds and the CRB
08/16/02 10:49:00 AMby David Penn
A July diamond anticipates sizable moves in the commodities index. Will grains continue to gain?
Position: N/A
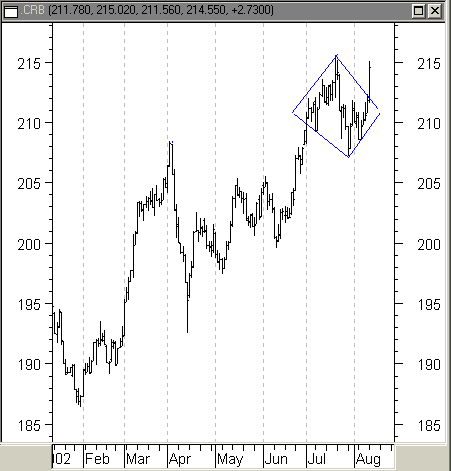
| Those who have been seduced into the "end of disinflation" theme offered by such wise men as Bill Gross of Pimco have likely taken the CRB Index's bull market in 2002 as evidence. This is not without good reason. Beginning the year just above 186, the CRB Index has appreciated some 16% by mid-July to reach 215. To be sure, commodities' gains have come at the expense of stocks (the S&P 500 is down 21% year-to-date). But the question of the moment is whether or not commodities will continue to advance going into the fall of 2002, or whether they will suffer a correction. |
| This makes the July diamond in the CRB an important chart pattern. The July diamond developed in the wake of the April correction and subsequent rally in the CRB over the summer months. Recall that diamond tops (or bottoms, for that matter) can serve as both reversal formations as well as continuation formations. As such, diamonds can be important accumulation/distribution areas from which powerful moves often result. The diamond pattern looks exactly as it sounds: two sets of parallel trendlines encompassing price action that often consists of a rally to a new high, a sharp (though not necessarily deep) correction, followed by a new rally. |

|
| Figure 1: A diamond top at the end of this CRB Index bull market suggests that a major break may occur soon. |
| Graphic provided by: MetaStock. |
| |
| In trading diamonds, one strategy is to wait for a breakout or breakdown to move beyond the short-term high or low that establishes the diamond's boundaries on the right side. For example, the CRB Index appears to be breaking out on the upside. The short-term high that establishes the slope of the diamond's boundary on the right side is just above 212. Conversely, if the CRB Index had broken down, the short-term low that establishes the slope of the diamond's boundary on the right side is 208.50. Whichever way that prices break out/down from the diamond, a price target can still be devised. Price targets for diamonds are calculated by adding the value of the formation size (215.5-207=8.5) to the value at the break out/down point (211.75 here). This gives a minimum upside target for the July CRB diamond of 220.25. As an aside, the March/April rally and correction in the CRB came mostly on the back of the energy group, which peaked and collapsed in sync with the CRB. However, the CRB's summer gains look to be largely the work of soaring agricultural prices, as the chart of the GSCI Agriculture Index below suggests: |
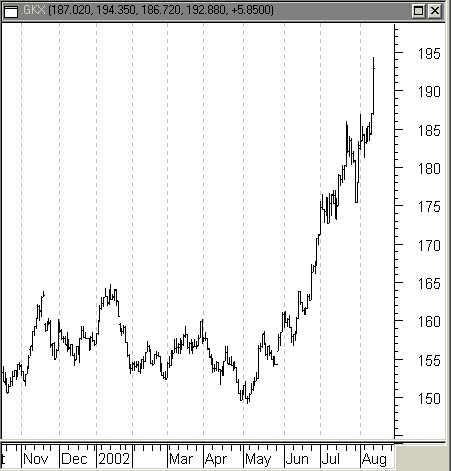
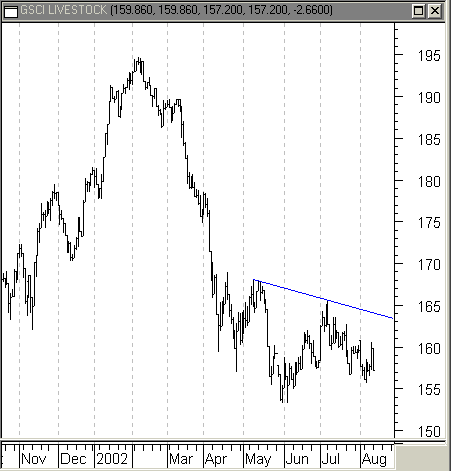
 Figure 2: As the GSCI Agricultural index goes parabolic, risks of a reversal increase. The GSCI Agriculture Index is up 23% year-to-date, with a nearly-parabolic May to mid-August gain of 30%. While this does account for the summer leadership in the CRB Index, it does also suggest that new leadership may be necessary to carry the CRB Index to new highs in the fall -- assuming the GSCI Agriculturals are unable to keep up their already blistering pace. One possible source for this leadership may be livestock. As the GSCI Livestock Index shows, the bear market in livestock appears to be putting in a bottom in May and June 2002. While the $GVX is still trading near major lows (154, with the index last trading at about 157), the index does appear to be forming a rather dilapidated head and shoulders bottom, with shoulders in the April and early August declines. |
 Figure 3: The GSCI Livestock index makes a bottom during the spring and summer of 2002. The breakout area for an advance in the $GVX somewhere along a downward sloping resistance "neckline" from the rally peak in early May to the rally peak in early July. As of mid-August, that resistance was around 163.50. A breakout above these levels could take the GSCI Livestock Index to around 193, and a test of the year-to-date highs just north of 195. |
Technical Writer for Technical Analysis of STOCKS & COMMODITIES magazine, Working-Money.com, and Traders.com Advantage.
| Title: | Technical Writer |
| Company: | Technical Analysis, Inc. |
| Address: | 4757 California Avenue SW |
| Seattle, WA 98116 | |
| Phone # for sales: | 206 938 0570 |
| Fax: | 206 938 1307 |
| Website: | www.Traders.com |
| E-mail address: | DPenn@traders.com |
Traders' Resource Links | |
| Charting the Stock Market: The Wyckoff Method -- Books | |
| Working-Money.com -- Online Trading Services | |
| Traders.com Advantage -- Online Trading Services | |
| Technical Analysis of Stocks & Commodities -- Publications and Newsletters | |
| Working Money, at Working-Money.com -- Publications and Newsletters | |
| Traders.com Advantage -- Publications and Newsletters | |
| Professional Traders Starter Kit -- Software | |
Click here for more information about our publications!
Comments

Request Information From Our Sponsors
- VectorVest, Inc.
- Executive Premier Workshop
- One-Day Options Course
- OptionsPro
- Retirement Income Workshop
- Sure-Fire Trading Systems (VectorVest, Inc.)
- Trading as a Business Workshop
- VectorVest 7 EOD
- VectorVest 7 RealTime/IntraDay
- VectorVest AutoTester
- VectorVest Educational Services
- VectorVest OnLine
- VectorVest Options Analyzer
- VectorVest ProGraphics v6.0
- VectorVest ProTrader 7
- VectorVest RealTime Derby Tool
- VectorVest Simulator
- VectorVest Variator
- VectorVest Watchdog
- StockCharts.com, Inc.
- Candle Patterns
- Candlestick Charting Explained
- Intermarket Technical Analysis
- John Murphy on Chart Analysis
- John Murphy's Chart Pattern Recognition
- John Murphy's Market Message
- MurphyExplainsMarketAnalysis-Intermarket Analysis
- MurphyExplainsMarketAnalysis-Visual Analysis
- StockCharts.com
- Technical Analysis of the Financial Markets
- The Visual Investor
