HOT TOPICS LIST
- MACD
- Fibonacci
- RSI
- Gann
- ADXR
- Stochastics
- Volume
- Triangles
- Futures
- Cycles
- Volatility
- ZIGZAG
- MESA
- Retracement
- Aroon
INDICATORS LIST
LIST OF TOPICS
PRINT THIS ARTICLE
by Koos van der Merwe
Pressure increases on Michael Dell as Carl Icahn mulls tie-up with Blackstone in bid for PC company.
Position: Hold
Koos van der Merwe
Has been a technical analyst since 1969, and has worked as a futures and options trader with First Financial Futures in Johannesburg, South Africa.
PRINT THIS ARTICLE
ELLIOTT WAVE
That Blackstone Group
03/27/13 04:16:13 PMby Koos van der Merwe
Pressure increases on Michael Dell as Carl Icahn mulls tie-up with Blackstone in bid for PC company.
Position: Hold
| Carl Icahn has said that he is open to a partnership with Blackstone Group in a move that could make it easier for the rival investors to overtake Michael Dell's $24.4 billion buyout bid for the company he founded, reports Reuters. This means Michael Dell could also potentially lose control of the PC maker he founded when he was 19 years old. Blackstone is said to be the world's largest private equity group. But what and who is Blackstone? What do the charts tell us? |

|
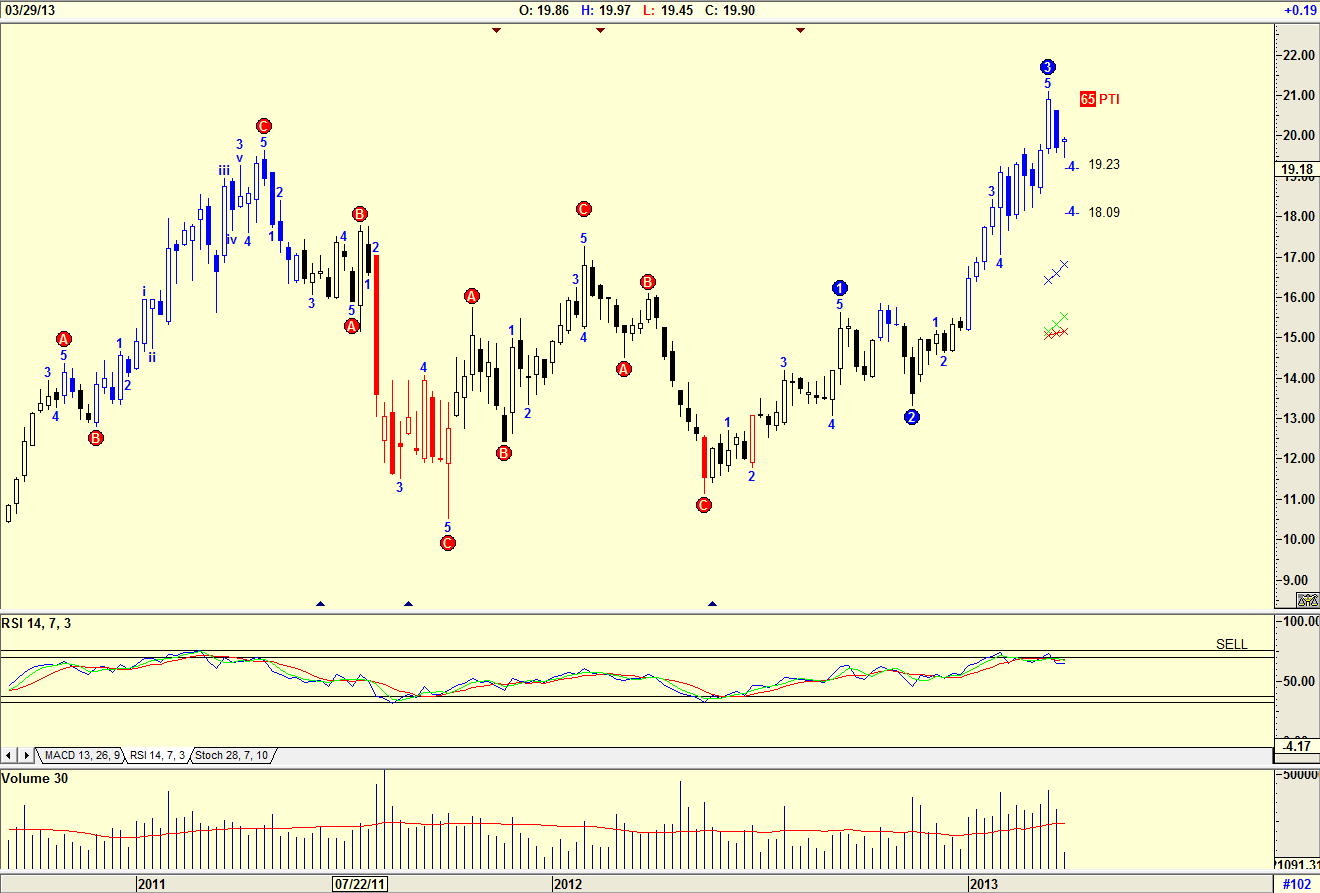
| Figure 1. Weekly chart of Blackstone Group LP. |
| Graphic provided by: AdvancedGET. |
| |
| The weekly chart in Figure 1 of Blackstone shows an Elliott Wave count suggested by the program Advanced GET. The chart suggests that the share price could correct in a WAVE 4 to either $19.23 or $18.09. The Probability Index (PTI) suggests a 65% probability of this occurring, which is high. The RSI indicator has given a sell signal. Volume however does appear to be falling as the share price corrects, a sign that the correction could be suspect. |

|
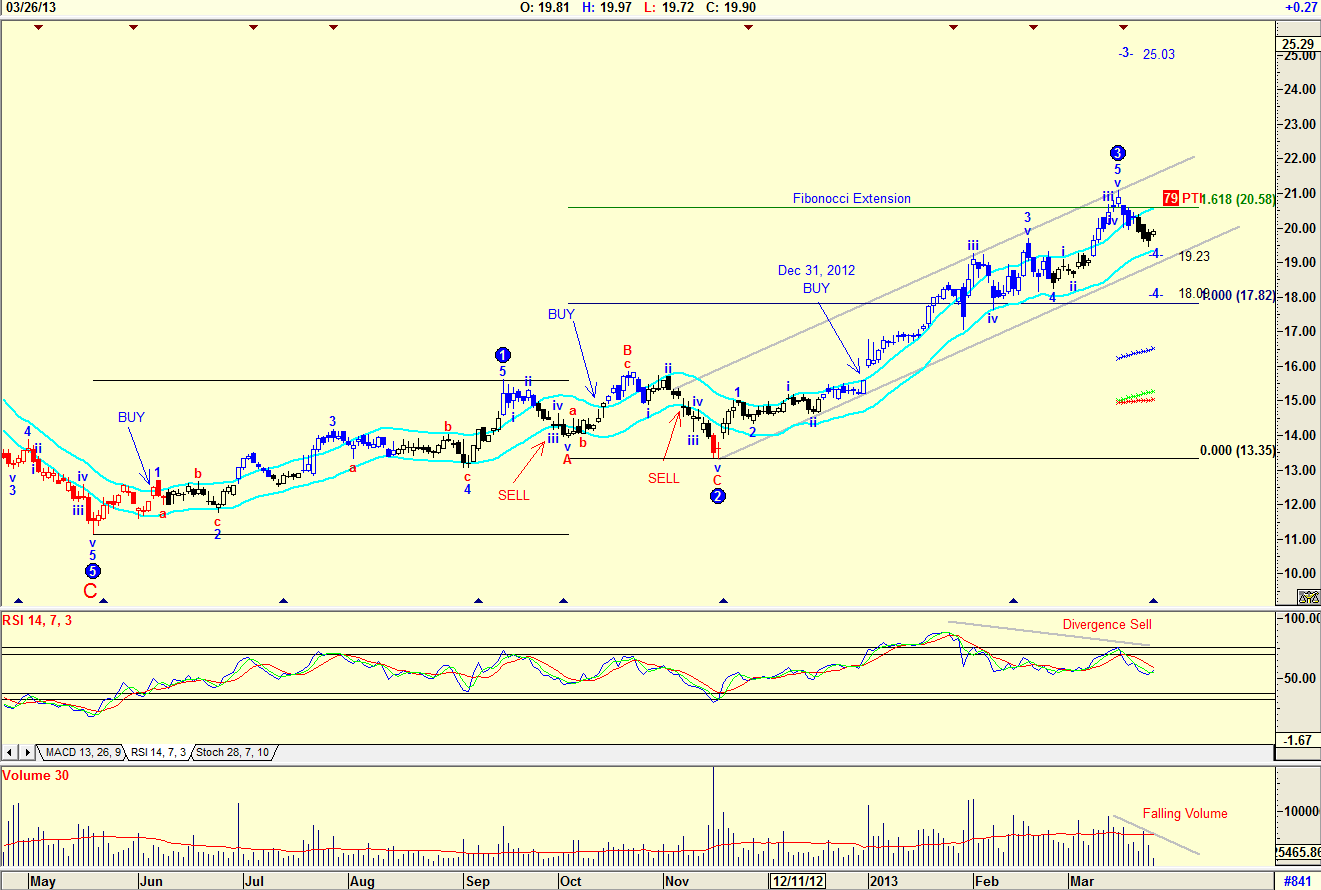
| Figure 2. Daily chart of Blackstone Group LP. |
| Graphic provided by: AdvancedGET. |
| |
| The daily chart in Figure 2 confirms the Wave 4 correction shown by the weekly chart. The support line shown on the chart suggests that the price could find support at $19.23 rather than fall to $18.09. The JM Internal Band indicator gave a buy signal on December 31, 2012, and has not yet given a sell signal. The JM Internal Band indicator is a 15-period simple moving average (SMA) offset by 2% positive and 2% negative. A buy signal occurs when the price breaks above the upper band and a sell signal occurs when the price breaks below the lower band. The indicator is a conservative indicator, used mainly by investors rather than traders. Note the divergence sell signal given by the RSI indicator. A contrary indicator is the falling volume as the share price fell. This suggests that the correction is a weak one. Also note the Fibonacci extension, which at the Wave 3 top is a 1.618 Fib reading of Wave 1 taken from the low of Wave 2. This suggests that the Wave 3 count is correct, even though the Advanced GET program is suggesting that Wave 3 could rise to $25.03. We all know, fundamentally, that when a company spends capital to purchase another company, the share price falls until the company that has been purchased is successfully integrated and managed. Should the purchase of DELL be completed, the price could fall to the lower Wave 4 level of $17.82. However, should the offer to purchase Dell be refused, the share price should start rising. |
Has been a technical analyst since 1969, and has worked as a futures and options trader with First Financial Futures in Johannesburg, South Africa.
| Address: | 3256 West 24th Ave |
| Vancouver, BC | |
| Phone # for sales: | 6042634214 |
| E-mail address: | petroosp@gmail.com |
Click here for more information about our publications!
Comments

|

Request Information From Our Sponsors
- StockCharts.com, Inc.
- Candle Patterns
- Candlestick Charting Explained
- Intermarket Technical Analysis
- John Murphy on Chart Analysis
- John Murphy's Chart Pattern Recognition
- John Murphy's Market Message
- MurphyExplainsMarketAnalysis-Intermarket Analysis
- MurphyExplainsMarketAnalysis-Visual Analysis
- StockCharts.com
- Technical Analysis of the Financial Markets
- The Visual Investor
- VectorVest, Inc.
- Executive Premier Workshop
- One-Day Options Course
- OptionsPro
- Retirement Income Workshop
- Sure-Fire Trading Systems (VectorVest, Inc.)
- Trading as a Business Workshop
- VectorVest 7 EOD
- VectorVest 7 RealTime/IntraDay
- VectorVest AutoTester
- VectorVest Educational Services
- VectorVest OnLine
- VectorVest Options Analyzer
- VectorVest ProGraphics v6.0
- VectorVest ProTrader 7
- VectorVest RealTime Derby Tool
- VectorVest Simulator
- VectorVest Variator
- VectorVest Watchdog
