HOT TOPICS LIST
- MACD
- Fibonacci
- RSI
- Gann
- ADXR
- Stochastics
- Volume
- Triangles
- Futures
- Cycles
- Volatility
- ZIGZAG
- MESA
- Retracement
- Aroon
INDICATORS LIST
LIST OF TOPICS
PRINT THIS ARTICLE
by Koos van der Merwe
With the release of the Blackberry in the US on March 22, 2013 many investors are looking at other Canadian technology companies. Aastra Technologies (AAH-T) is a company worth looking at.
Position: Accumulate
Koos van der Merwe
Has been a technical analyst since 1969, and has worked as a futures and options trader with First Financial Futures in Johannesburg, South Africa.
PRINT THIS ARTICLE
CUP WITH HANDLE
A Possible Buy
03/26/13 10:01:08 AMby Koos van der Merwe
With the release of the Blackberry in the US on March 22, 2013 many investors are looking at other Canadian technology companies. Aastra Technologies (AAH-T) is a company worth looking at.
Position: Accumulate
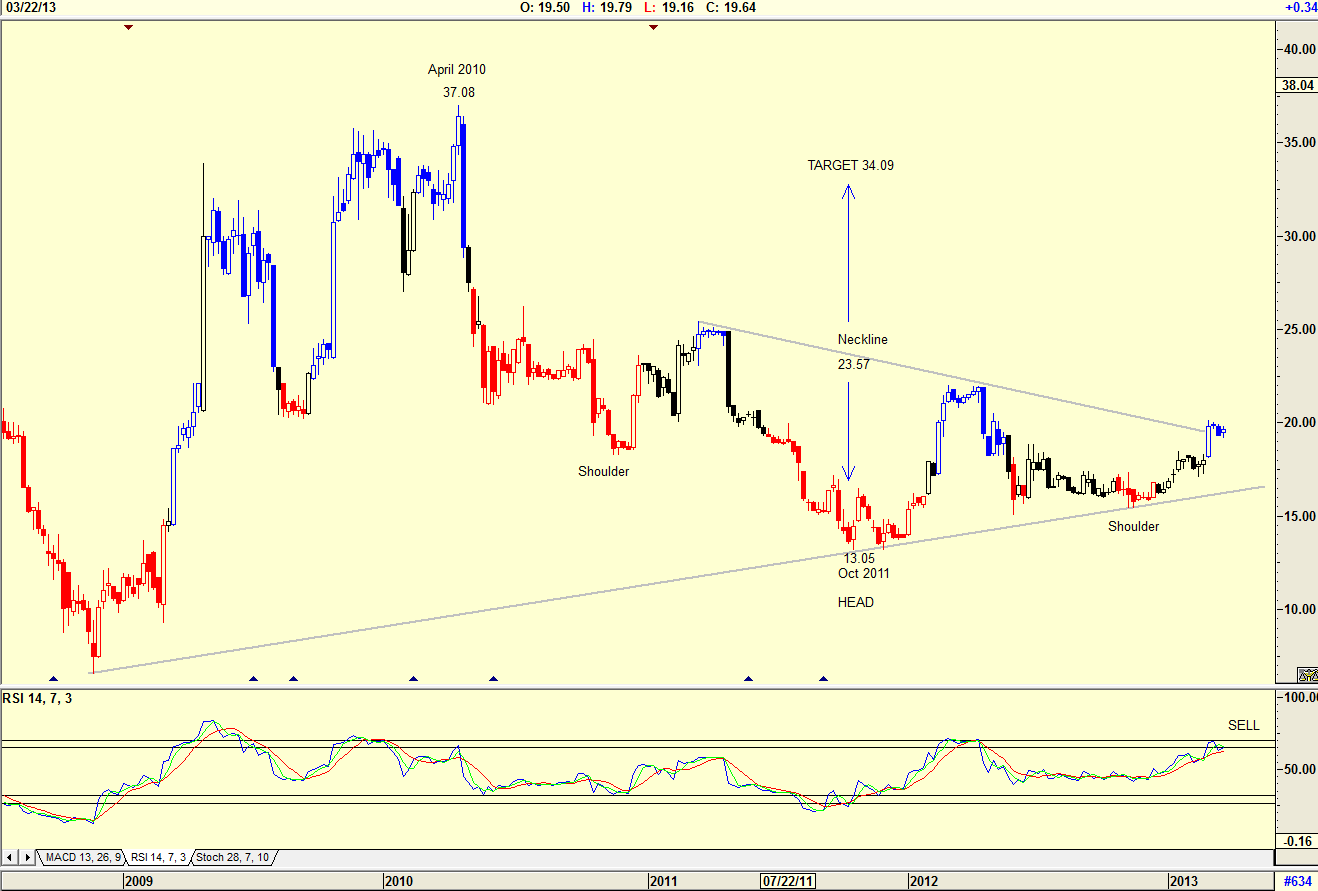
| Since the recovery in the stock market looks like it is definite, investors or traders are always looking for stocks to buy on a correction. One of the stocks that caught my attention is AAH-T. This is a share that in April 2010 reached a high of $37.08, and then dropped to a low of $13.05 by October 2011. Since then the share has slowly moved up to its current price of $20.00, but with two patterns on a weekly chart that captures your attention. |

|
| Figure 1. Weekly Chart of Aastra Technologies |
| Graphic provided by: AdvancedGET. |
| |
| On the weekly chart of AAH-T in Figure 1, you can see that share prices bounced off their support line. The chart also shows what looks like a reverse head and shoulder formation with the price breaking above the neckline. This suggests that the price could rise to $34.09. (23.57 - 13.05 = 10.52 + 23.57 = 34.09). The RSI is at overbought levels, suggesting a sell. The weekly chart therefore suggests that you should therefore wait for the correction to occur before buying. |

|
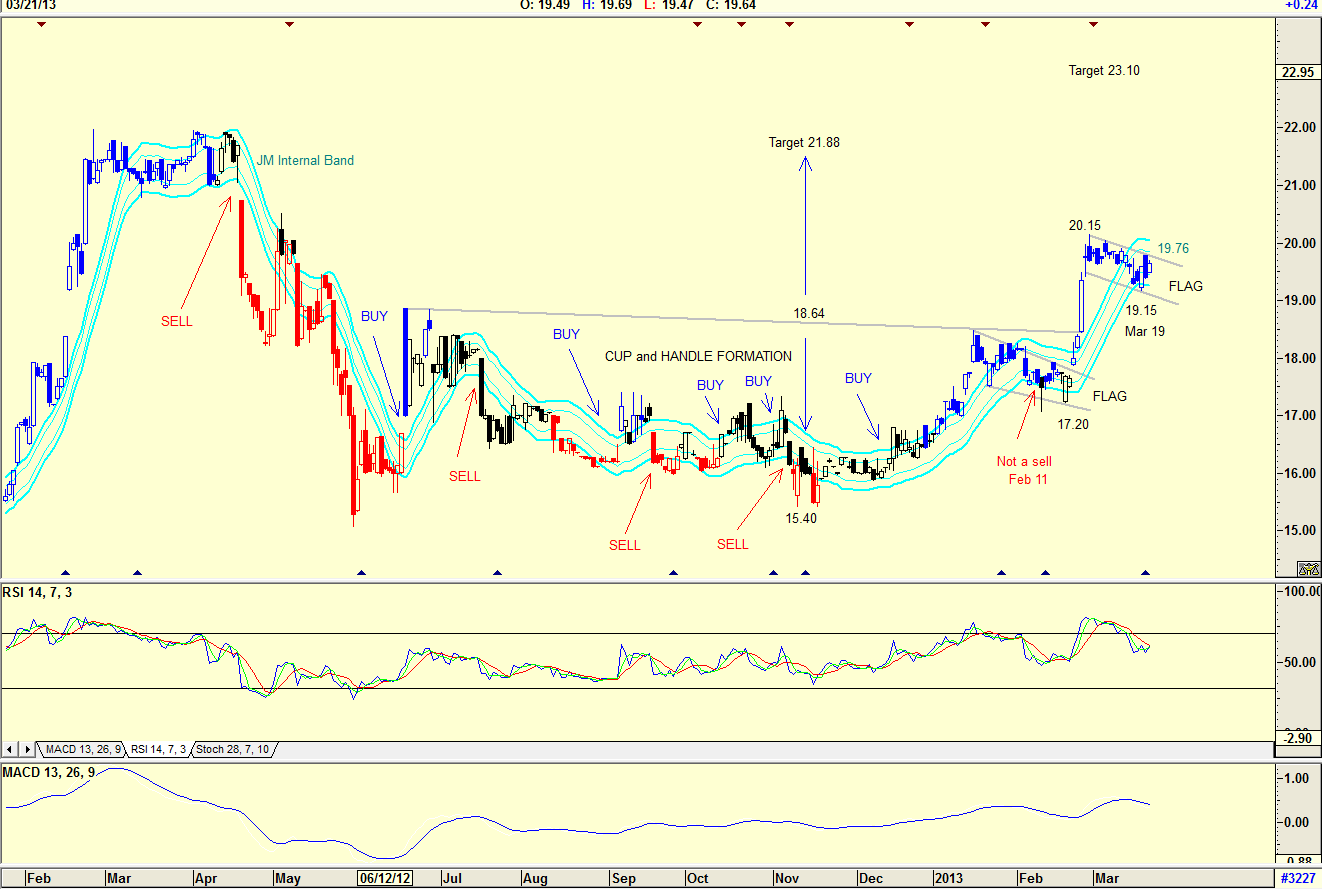
| Figure 2. Daily Chart of Aastra Technologies |
| Graphic provided by: AdvancedGET. |
| |
| The daily chart in Figure 2 shows that the share price formed a cup and handle pattern followed by two flag patterns. The cup and handle pattern suggests a target of $21.88 ( 18.64-15.40=3.24+18.64=21.88) and the flag pattern suggests a target of $23.10 (20.15-17.20=2.95+20.15=23.10). The chart also shows the JM Internal Band, which is a 15- period simple moving average (SMA) offset by 2% positive and 2% negative. A buy signal is triggered when the close breaks above the upper band, and a sell signal is triggered when the close breaks below the lower band. Do note that on February 11, 2013 the closing price did not break below the lower band, so a sell was not triggered. The RSI Indicator is in sell mode, as is the MACD indicator. I would therefore not be a buyer of the share at the moment. I would however buy half of what I intended to buy should the price move above $19.76, the upper trendline of the flag pattern, and the other half when the closing price breaks above the upper JM Internal band line. |
Has been a technical analyst since 1969, and has worked as a futures and options trader with First Financial Futures in Johannesburg, South Africa.
| Address: | 3256 West 24th Ave |
| Vancouver, BC | |
| Phone # for sales: | 6042634214 |
| E-mail address: | petroosp@gmail.com |
Click here for more information about our publications!
PRINT THIS ARTICLE

|

Request Information From Our Sponsors
- VectorVest, Inc.
- Executive Premier Workshop
- One-Day Options Course
- OptionsPro
- Retirement Income Workshop
- Sure-Fire Trading Systems (VectorVest, Inc.)
- Trading as a Business Workshop
- VectorVest 7 EOD
- VectorVest 7 RealTime/IntraDay
- VectorVest AutoTester
- VectorVest Educational Services
- VectorVest OnLine
- VectorVest Options Analyzer
- VectorVest ProGraphics v6.0
- VectorVest ProTrader 7
- VectorVest RealTime Derby Tool
- VectorVest Simulator
- VectorVest Variator
- VectorVest Watchdog
- StockCharts.com, Inc.
- Candle Patterns
- Candlestick Charting Explained
- Intermarket Technical Analysis
- John Murphy on Chart Analysis
- John Murphy's Chart Pattern Recognition
- John Murphy's Market Message
- MurphyExplainsMarketAnalysis-Intermarket Analysis
- MurphyExplainsMarketAnalysis-Visual Analysis
- StockCharts.com
- Technical Analysis of the Financial Markets
- The Visual Investor
