

HOT TOPICS LIST
- MACD
- Fibonacci
- RSI
- Gann
- ADXR
- Stochastics
- Volume
- Triangles
- Futures
- Cycles
- Volatility
- ZIGZAG
- MESA
- Retracement
- Aroon
INDICATORS LIST
LIST OF TOPICS
PRINT THIS ARTICLE
by Donald W. Pendergast, Jr.
Shares of Comp De Minas Buenaventura took quite a beating over the past two months, but signs of a bullish turnaround are now manifesting.
Position: N/A
Donald W. Pendergast, Jr.
Freelance financial markets writer and online publisher of the Trendzetterz.com S&P 500 Weekly Forecast service.
PRINT THIS ARTICLE
RSI
BVN: Making A Bullish U-Turn?
03/25/13 03:06:44 PMby Donald W. Pendergast, Jr.
Shares of Comp De Minas Buenaventura took quite a beating over the past two months, but signs of a bullish turnaround are now manifesting.
Position: N/A
| The last 10 weeks have been tough for long-term shareholders of Comp De Minas Buenaventura stock (BVN); from January 22 - March 6, 2013 BVN lost nearly 32% of its value, and many of its peers in the Gold Bugs Index (.HUI) also suffered similarly severe haircuts. Over the past few weeks, however, BVN and most of its brethren in the .HUI have put in major lows (of a multi-role cycle variety) and/or bullish basing patterns. Here is a closer look at the nascent bullish breakout now underway in BVN, along with some ideas on how to play a near-term rally. |

|
| Figure 1 - BVN will generally rally for a time once its eight-period RSI crosses above 60.00 in conjunction with a close above its 21-day exponential moving average (EMA). Wise trade management and risk control is paramount if profits are to be realized on these kinds of short term trades. |
| Graphic provided by: TradeStation. |
| |
| BVN has a wide variety of trading characteristics, and it is always a surprise to see what kind of price action will appear over a given time period; sometimes, the stock trends in a smooth, steady, low volatility manner - as was the case with its most recent decline - while at other times the stock is very chaotic, subject to violent whipsaws and knee-jerk breakouts that quickly fizzle and fade. Generally speaking, the stock seems better suited for short-term stock/options players than for long-term trend followers (most of the time) and, as such, the technical indicator we will look at in this article is more suited for these short-term stock and option players seeking to capitalize on the quick bursts of directional movement so typical in BVN. This indicator is an eight-period RSI, plotted as a histogram with its overbought/oversold levels set at 60 and 40, respectively. It can sometimes be used in conjunction with a 21-day exponential moving average (EMA), with a trader taking long RSI breakouts (a rise above 60.00) when a stock's price is greater than the EMA (and vice-versa for short entries where an RSI breakdown below 40.00 is needed). During the morning trading session on March 21, 2013, BVN did rise far enough to trigger an intraday break above 60.00 on the RSI and if the stock can manage a daily close above the 21-day EMA (at 25.78), gold bugs will have a valid long entry setup in place; here's how to trade it: 1. Place a buy stop market order at 26.00. 2. If filled on the trade, immediately start running a two-bar trailing stop of the daily lows. 3. If 28.00 is reached quickly, without a meaningful pullback before reaching that area, consider taking profits on at least half your position. 4. Trail the remainder of the position until final stop out. |
|
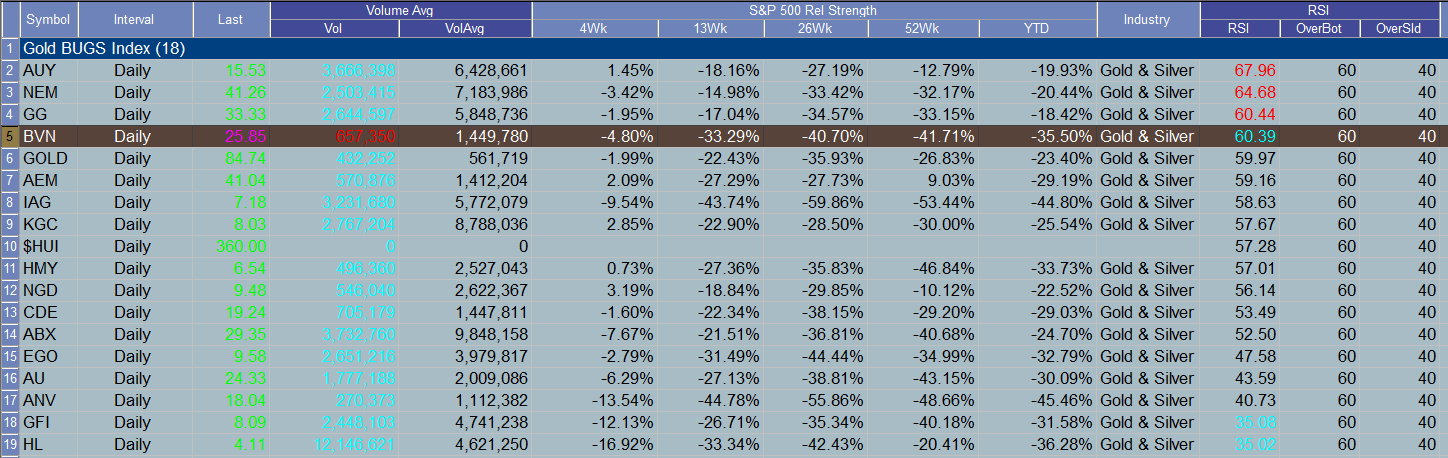
| Figure 2 - All the major players in the gold/silver mining stock universe are beginning to reverse strongly to the upside as of March 21, 2013. |
| Graphic provided by: TradeStation. |
| Graphic provided by: TradeStation Radar Screen. |
| |
| Selling a near-term, out-of-the money (OTM) put option is also a valid strategy here, but the bid-ask spread in BVN put options (especially the April 2013 puts) is poor, making the sale of puts a bad risk/reward opportunity compared to simply buying the stock alone. Call buyers may also find opportunity here, too; the bid-ask spread on the June '13 BVN $26.00 call is only .09 (1.30/1.39) as this is written - you may want to go for a nearer profit target than 28.00 if you choose to go this route. Time decay is small ($1/day per contract) and the option has a full three months of time value along with a decent open interest figure of 247 contracts. Since this is a reversal-style breakout, it might be prudent to limit your account risk on this trade to about 1%, no matter how bullish this setup looks (and it really does look good), just in case it doesn't pan out exactly as planned. As always, trade wisely until we meet here again. |
Freelance financial markets writer and online publisher of the Trendzetterz.com S&P 500 Weekly Forecast service.
| Title: | Market consultant and writer |
| Company: | Trendzetterz |
| Address: | 81 Hickory Hollow Drive |
| Crossville, TN 38555 | |
| Phone # for sales: | 904-303-4814 |
| Website: | trendzetterz.com |
| E-mail address: | support@trendzetterz.com |
Traders' Resource Links | |
| Trendzetterz has not added any product or service information to TRADERS' RESOURCE. | |
Click here for more information about our publications!
Comments

Request Information From Our Sponsors
- VectorVest, Inc.
- Executive Premier Workshop
- One-Day Options Course
- OptionsPro
- Retirement Income Workshop
- Sure-Fire Trading Systems (VectorVest, Inc.)
- Trading as a Business Workshop
- VectorVest 7 EOD
- VectorVest 7 RealTime/IntraDay
- VectorVest AutoTester
- VectorVest Educational Services
- VectorVest OnLine
- VectorVest Options Analyzer
- VectorVest ProGraphics v6.0
- VectorVest ProTrader 7
- VectorVest RealTime Derby Tool
- VectorVest Simulator
- VectorVest Variator
- VectorVest Watchdog
- StockCharts.com, Inc.
- Candle Patterns
- Candlestick Charting Explained
- Intermarket Technical Analysis
- John Murphy on Chart Analysis
- John Murphy's Chart Pattern Recognition
- John Murphy's Market Message
- MurphyExplainsMarketAnalysis-Intermarket Analysis
- MurphyExplainsMarketAnalysis-Visual Analysis
- StockCharts.com
- Technical Analysis of the Financial Markets
- The Visual Investor