

HOT TOPICS LIST
- MACD
- Fibonacci
- RSI
- Gann
- ADXR
- Stochastics
- Volume
- Triangles
- Futures
- Cycles
- Volatility
- ZIGZAG
- MESA
- Retracement
- Aroon
INDICATORS LIST
LIST OF TOPICS
PRINT THIS ARTICLE
by Donald W. Pendergast, Jr.
Just like its large and small cap peers, this key mid-cap stock ETF has been very strong but may be near to an important cycle high.
Position: N/A
Donald W. Pendergast, Jr.
Freelance financial markets writer and online publisher of the Trendzetterz.com S&P 500 Weekly Forecast service.
PRINT THIS ARTICLE
CYCLES
MDY: Closing In On A Major High?
03/25/13 10:25:26 AMby Donald W. Pendergast, Jr.
Just like its large and small cap peers, this key mid-cap stock ETF has been very strong but may be near to an important cycle high.
Position: N/A
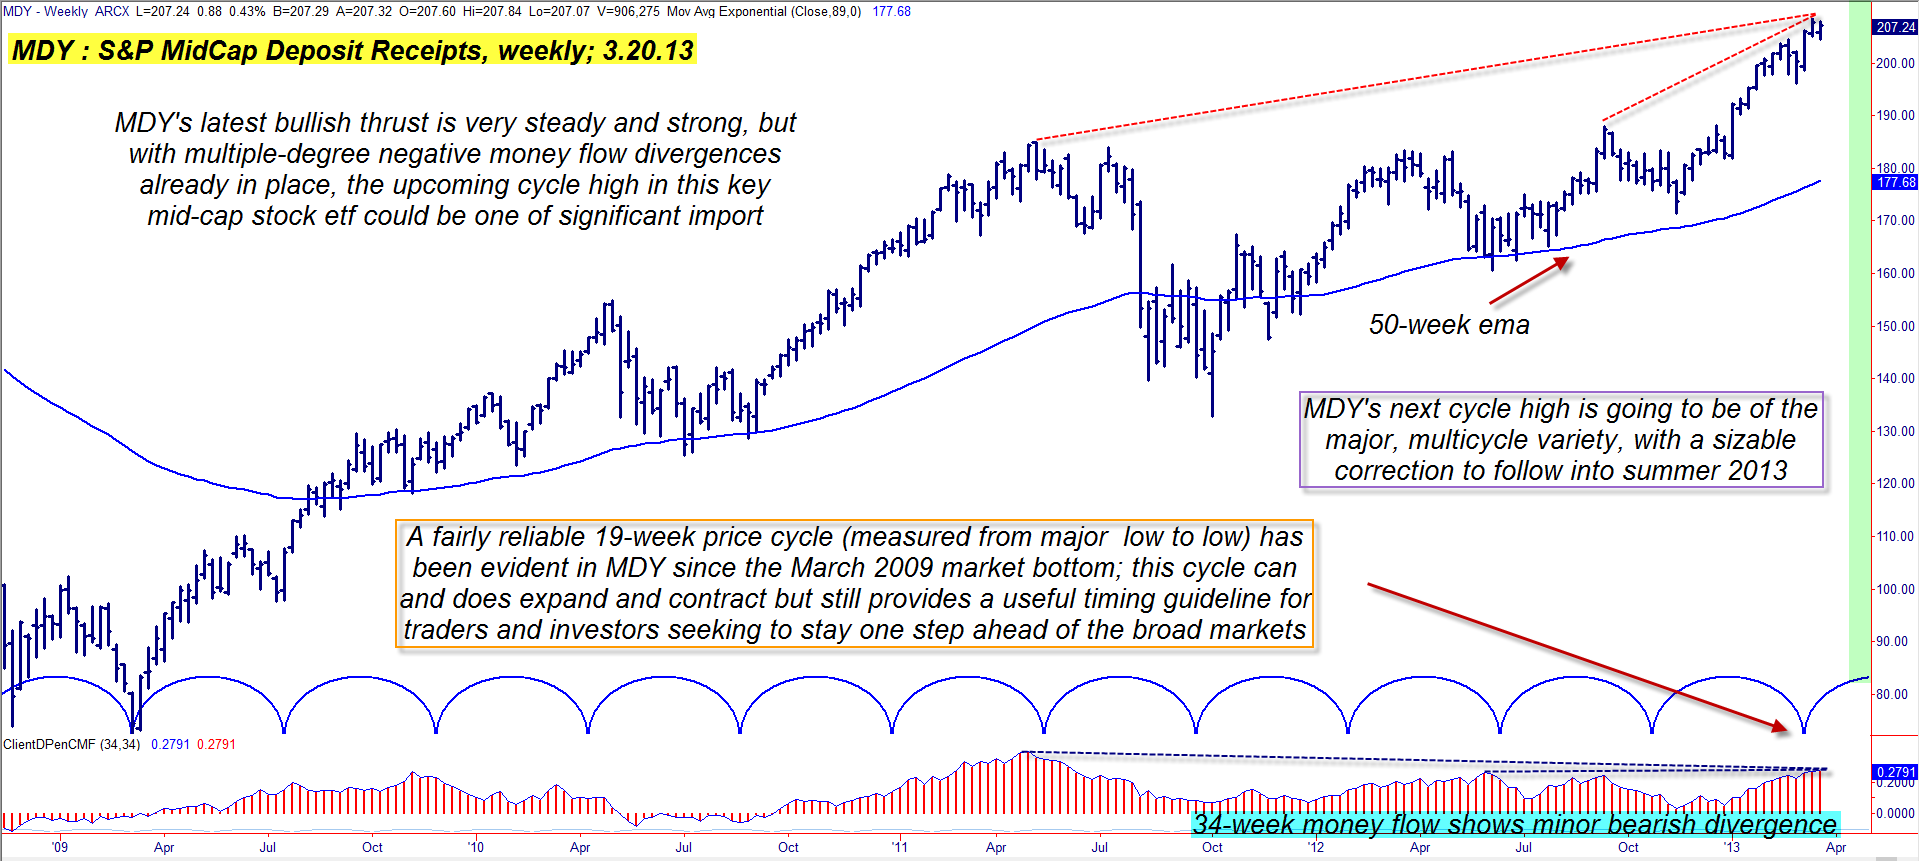
| Less volatile than small caps, but a bit more energetic than large caps, the mid-cap stocks in the US broad market indexes have consistently proven themselves to be capable of sustained trending moves (bullish and bearish) over the years. The entire S&P 400 MidCap index can actually be traded in real-time (long or short) as a single entity by using ticker symbol MDY as a way to get exposure to the day-to-day moves of the index. MDY is currently in the midst of a very solid rally, one that launched in mid-November 2012 and which has resulted in a 21% gain in little more than four months, but skilled chartists are now noticing that the price cycle and money flow characteristics for this ETF are now suggesting that this rally may be getting close to its terminal zone. Here's a closer look now, using MDY's daily chart (Figure 1). |
|
| Figure 1: Market cycles can and do contract and expand, yet they can still prove to be of great defensive and offensive value to traders and investors who seek to stay on the 'right' side of a given market. |
| Graphic provided by: TradeStation. |
| |
| MDY can certainly make sustained, long-term trending moves, as its 186% rise since March 2009 can attest to; since the end of the major 2009 sell-off, MDY is up by more than 56% as well, outperforming its large cap brother (SPY) by a noticeable margin. During the four-plus years since the generational low was made in March 2009, a very reliable 19-week price cycle has become evident in this market, one that can be a big help to those seeking to gain an edge in the markets. Several days ago, my article on the Russell 2000 index referred to a reliable (but slightly volatile) 16-week price cycle and in past issues of TCA I have also written about the existence of a recurring 20-week price cycle in the S&P 500 index (.SPX); it is interesting to note how close, on average, the numbers are in each index. While some cycle analysts are adamant in their belief that intrinsic cycles determine the price movements in a given market, there are others (myself included) who simply accept that cycles exist and that it is the generally unpredictable actions of individual traders and investors that create a given cycle, rather than the cycle controlling the actions of investors; there is of course a 'positive feedback' loop that gets started as investors react, a cycle begins, investors notice the cycle and react yet again, a cycle ends and the whole game begins anew. It's sort of the old 'chicken and the egg' paradigm in some respects, as we may never truly know the precise factors driving the timing of any given market cycle and the best we can do is try to stay on the right side of it as best we can as we trade and invest in the markets everyday. With that rather basic dissertation on cycle theory out of the way, let's look at MDY's chart, where we see the following: 1. The 34-week Chaikin Money flow histogram (CMF)(34) is confirming that MDY's latest series of rallies are running on borrowed time; bearish money flow divergences with price action nearly always precede major tops and bottoms in a market. 2. We also see that MDY's 19-week cycle is still in rising mode but is expected to top no later than the second half of April 2013. So, although it's too early to start running really close stops on existing mid-cap stock positions, it might be wise to be less aggressive in putting on new long positions once early April 2013 arrives. Markets can sometimes get very dangerous and volatile at major tops, depending on a variety of factors; since we are likely looking at a major multicycle high in the US markets next month, it just makes sense to be a bit more cautious with your hard won portfolio gains. |
|
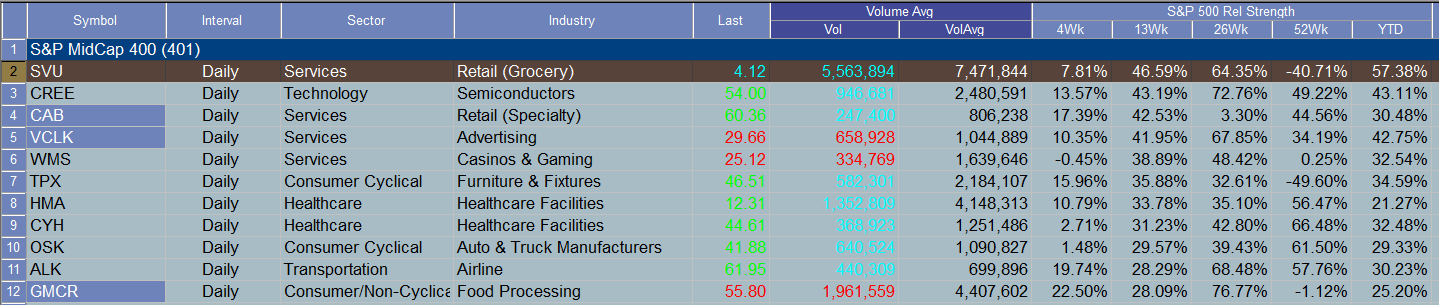
| Figure 2: Mid-cap stocks have had remarkable rallies as of late; traders long any of the stocks listed above would do well to lock in at least some of their hard-won gains now, in advance of a major market high in April 2013. |
| Graphic provided by: TradeStation. |
| Graphic provided by: TradeStation Radar Screen. |
| |
| Many mid-caps have enjoyed terrific rallies of late, so if any of your favorite stocks are on the above relative strength ranking table, take extra care to lock in gains now before the next cycle high arrives next month. Trade wisely until we meet here again. |
Freelance financial markets writer and online publisher of the Trendzetterz.com S&P 500 Weekly Forecast service.
| Title: | Market consultant and writer |
| Company: | Trendzetterz |
| Address: | 81 Hickory Hollow Drive |
| Crossville, TN 38555 | |
| Phone # for sales: | 904-303-4814 |
| Website: | trendzetterz.com |
| E-mail address: | support@trendzetterz.com |
Traders' Resource Links | |
| Trendzetterz has not added any product or service information to TRADERS' RESOURCE. | |
Click here for more information about our publications!
PRINT THIS ARTICLE

Request Information From Our Sponsors
- StockCharts.com, Inc.
- Candle Patterns
- Candlestick Charting Explained
- Intermarket Technical Analysis
- John Murphy on Chart Analysis
- John Murphy's Chart Pattern Recognition
- John Murphy's Market Message
- MurphyExplainsMarketAnalysis-Intermarket Analysis
- MurphyExplainsMarketAnalysis-Visual Analysis
- StockCharts.com
- Technical Analysis of the Financial Markets
- The Visual Investor
- VectorVest, Inc.
- Executive Premier Workshop
- One-Day Options Course
- OptionsPro
- Retirement Income Workshop
- Sure-Fire Trading Systems (VectorVest, Inc.)
- Trading as a Business Workshop
- VectorVest 7 EOD
- VectorVest 7 RealTime/IntraDay
- VectorVest AutoTester
- VectorVest Educational Services
- VectorVest OnLine
- VectorVest Options Analyzer
- VectorVest ProGraphics v6.0
- VectorVest ProTrader 7
- VectorVest RealTime Derby Tool
- VectorVest Simulator
- VectorVest Variator
- VectorVest Watchdog