

HOT TOPICS LIST
- MACD
- Fibonacci
- RSI
- Gann
- ADXR
- Stochastics
- Volume
- Triangles
- Futures
- Cycles
- Volatility
- ZIGZAG
- MESA
- Retracement
- Aroon
INDICATORS LIST
LIST OF TOPICS
PRINT THIS ARTICLE
by Alan R. Northam
While Apple remains in a long-term downward trend, an intermediate-term statistical analysis shows that Apple may be ready to shed some of its excess losses.
Position: N/A
Alan R. Northam
Alan Northam lives in the Dallas, Texas area and as an electronic engineer gave him an analytical mind from which he has developed a thorough knowledge of stock market technical analysis. His abilities to analyze the future direction of the stock market has allowed him to successfully trade of his own portfolio over the last 30 years. Mr. Northam is now retired and trading the stock market full time. You can reach him at inquiry@tradersclassroom.com or by visiting his website at http://www.tradersclassroom.com. You can also follow him on Twitter @TradersClassrm.
PRINT THIS ARTICLE
STATISTICS
Apple: A Case For Retracement
03/21/13 03:19:10 PMby Alan R. Northam
While Apple remains in a long-term downward trend, an intermediate-term statistical analysis shows that Apple may be ready to shed some of its excess losses.
Position: N/A
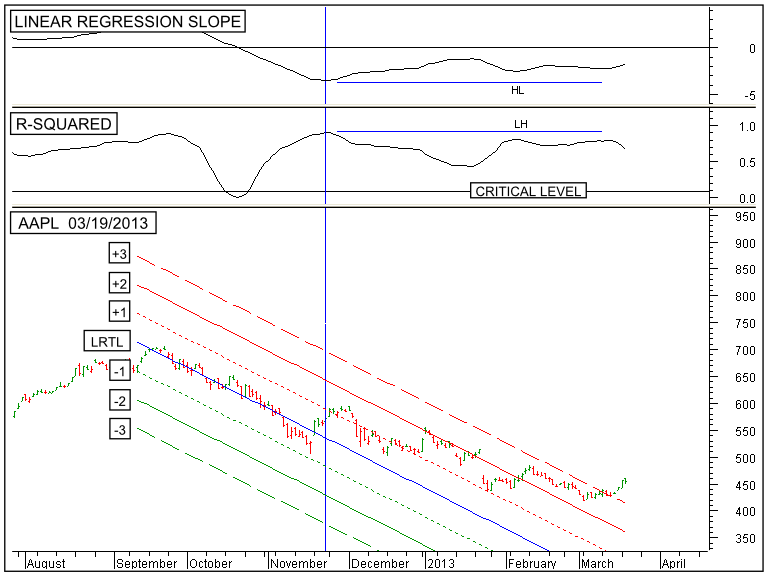
| On March 5, 2013, I published an article entitled "Apple In Established Long-Term Downward Trend". The long-term downward trend remains in play, but it now looks like the first leg down is complete and Apple is ready to shed some of its excess losses by retracing some of its steps downward. The following is my analysis: Figure 1 shows the daily price bars of Apple (AAPL), in the bottom window. The top window shows the linear regression slope indicator and the middle window shows the R-squared indicator. |
|
| Figure 1. AAPL, DAILY. Here you see the daily price chart of AAPL in the lower window, the 50-day linear regression trend line, and its associated channel lines. The top window shows the linear regression slope indicator followed by the R-squared indicator in the next lower window. |
| Graphic provided by: MetaStock. |
| |
| The 50-day linear regression slope indicator in the top window is below its zero line, indicating that the intermediate-term trend of AAPL is in the downward direction. However, this indicator bottomed in November 2012 and has been working its way upward. Notice that it has made a higher low, labeled 'HL' on the chart but has not yet made a higher high. Technically this indicator is moving sideways. If this indicator does not move above its zero line then the intermediate-term trend will remain in the downward direction. A move above the zero line, however, will indicate a reversal in the intermediate-term trend and a deeper retracement. |
| The 50-day R-squared indicator in the middle window shows that it peaked in November. Since that time this indicator has made a lower high, labeled 'LH' on the chart, but has not made a lower low. Technically this indicator continues to move sideways as does the linear regression slope indicator. This indicator needs to make a lower low to indicate that it is in a downward trend. Until then, this indicator remains in a trading range. A move below the critical level followed by a move back above the critical level along with the linear regression slope indicator moving below zero is necessary to establish AAPL in an intermediate-term upward trend. Such a move would indicate a deep retracement of the sell-off in Apple that started in September 2012. |
| The bottom window shows the daily price bars of AAPL. This window also shows the 50-day linear regression trend line (blue line) along with the upper 1 sigma channel line (red dotted line), the upper 2 sigma channel line (solid red line), the lower 1 sigma channel (green dotted line), the lower 2 sigma channel line (solid green line), and the lower 3 sigma channel line (dashed green line). The red channel lines represent resistance lines and the green channel lines represent support. Notice that price has now broken out above the +3 sigma channel line. This sends a signal that a possible reversal in the intermediate-term trend from down to up is in progress. However, to complete the reversal the linear regression slope indicator must move below its zero line and the R-squared indicator has to move below its critical level followed by a move back above its critical level. Until these things happen the retracement will remain shallow or the long term downward trend might resume. |
| In conclusion, price has broken out above the 50-day +3 sigma channel line to signal a possible reversal in the intermediate-term trend from down to up. However, the linear regression slope indicator must move above its zero line and the R-squared indicator must move below its critical level and then back above its critical level for the intermediate-term trend to reverse. A reversal in the intermediate-term trend would most likely mean a move back up to around 600, the resistance level of the 200 day -3 sigma channel line (see previous article mentioned earlier) and is also the 62% Fibonacci retracement level. Barring an intermediate-term trend reversal, any correction that occurs will be shallow or non-existent, in which case the long-term downward trend will continue. |
Alan Northam lives in the Dallas, Texas area and as an electronic engineer gave him an analytical mind from which he has developed a thorough knowledge of stock market technical analysis. His abilities to analyze the future direction of the stock market has allowed him to successfully trade of his own portfolio over the last 30 years. Mr. Northam is now retired and trading the stock market full time. You can reach him at inquiry@tradersclassroom.com or by visiting his website at http://www.tradersclassroom.com. You can also follow him on Twitter @TradersClassrm.
| Garland, Tx | |
| Website: | www.tradersclassroom.com |
| E-mail address: | inquiry@tradersclassroom.com |
Click here for more information about our publications!
Comments

Request Information From Our Sponsors
- StockCharts.com, Inc.
- Candle Patterns
- Candlestick Charting Explained
- Intermarket Technical Analysis
- John Murphy on Chart Analysis
- John Murphy's Chart Pattern Recognition
- John Murphy's Market Message
- MurphyExplainsMarketAnalysis-Intermarket Analysis
- MurphyExplainsMarketAnalysis-Visual Analysis
- StockCharts.com
- Technical Analysis of the Financial Markets
- The Visual Investor
- VectorVest, Inc.
- Executive Premier Workshop
- One-Day Options Course
- OptionsPro
- Retirement Income Workshop
- Sure-Fire Trading Systems (VectorVest, Inc.)
- Trading as a Business Workshop
- VectorVest 7 EOD
- VectorVest 7 RealTime/IntraDay
- VectorVest AutoTester
- VectorVest Educational Services
- VectorVest OnLine
- VectorVest Options Analyzer
- VectorVest ProGraphics v6.0
- VectorVest ProTrader 7
- VectorVest RealTime Derby Tool
- VectorVest Simulator
- VectorVest Variator
- VectorVest Watchdog