HOT TOPICS LIST
- MACD
- Fibonacci
- RSI
- Gann
- ADXR
- Stochastics
- Volume
- Triangles
- Futures
- Cycles
- Volatility
- ZIGZAG
- MESA
- Retracement
- Aroon
INDICATORS LIST
LIST OF TOPICS
PRINT THIS ARTICLE
by Koos van der Merwe
Once again Europe is affecting the US market. This time it is Cyprus. What now?
Position: Sell
Koos van der Merwe
Has been a technical analyst since 1969, and has worked as a futures and options trader with First Financial Futures in Johannesburg, South Africa.
PRINT THIS ARTICLE
ELLIOTT WAVE
Updating The Dow And S&P Indexes
03/21/13 03:13:47 PMby Koos van der Merwe
Once again Europe is affecting the US market. This time it is Cyprus. What now?
Position: Sell
| The first rule in Elliott Wave theory is that "the chart must look correct." This means that when it does not look like a simple count, and look correct, then you must change your count until it looks correct. An Elliott Wave count can therefore change as time progresses. This is one of the reasons I regard the Elliott Wave as a signpost, which will change direction just down the road at the next signpost. So, what do the indexes tell us now? |

|
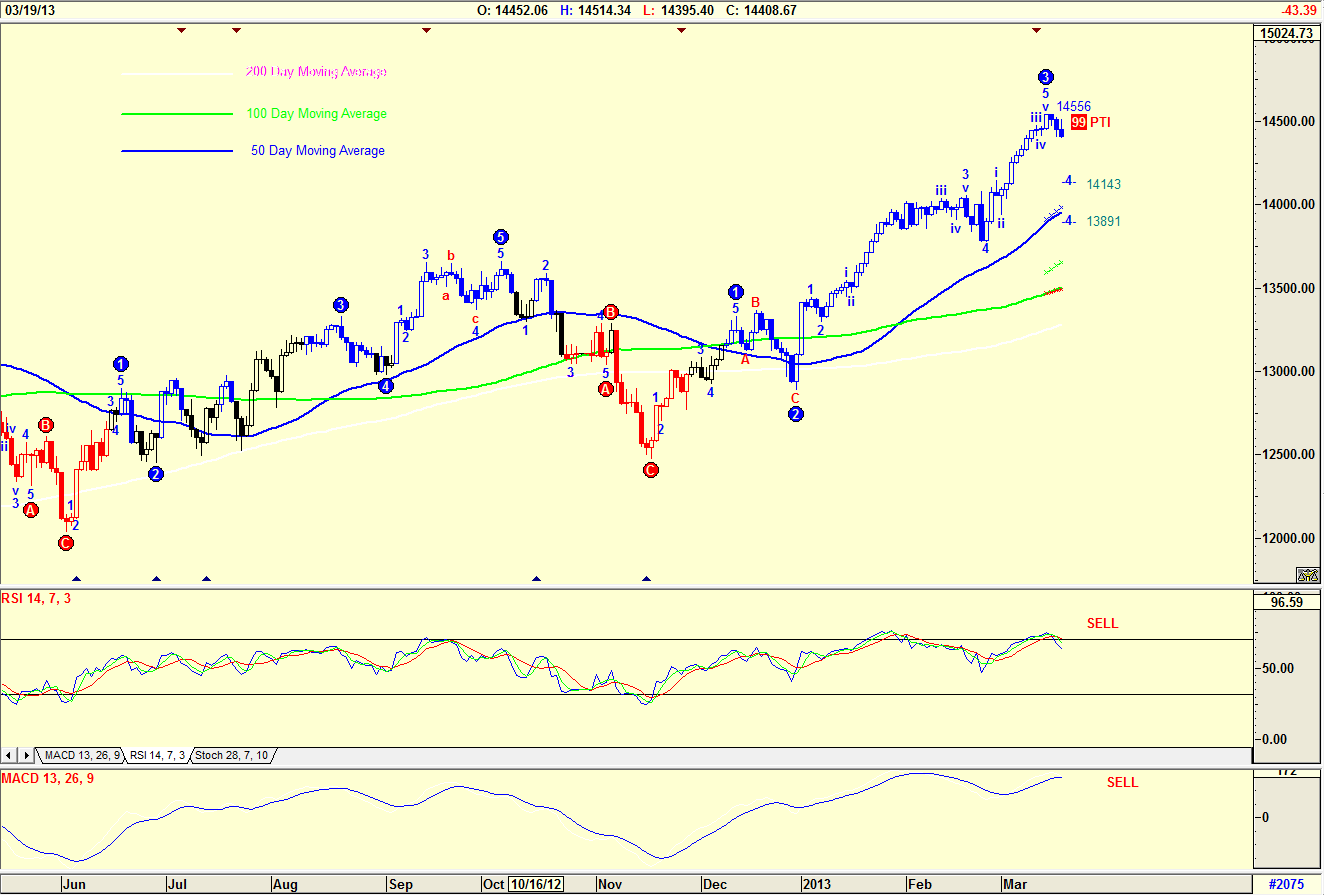
| FIGURE 1. Daily chart of the Dow Jones Industrial Average. |
| Graphic provided by: AdvancedGET. |
| |
| The daily chart of the Dow Jones Industrial Average in Figure 1 shows an Elliott Wave count given by the Advanced GET program. The chart is suggesting that the Dow is now in a WAVE 4 correction with possible targets of 14143 and 13891. The PTI (Probability Index) is 99, suggesting that there is a 99% probability that these targets could be reached. The RSI indicator is once again at overbought levels, and has given a sell signal, as has the MACD indicator. The wave count is therefore suggesting that a Wave 5 will see the Dow Index rise strongly above the Wave 3 high of 14556, suggesting that the Wave 4 correction is a good buying opportunity. However, Wave 2 looks like a simple wave, which does mean that Wave 4 could be complicated, or even simpler than Wave 2. |

|
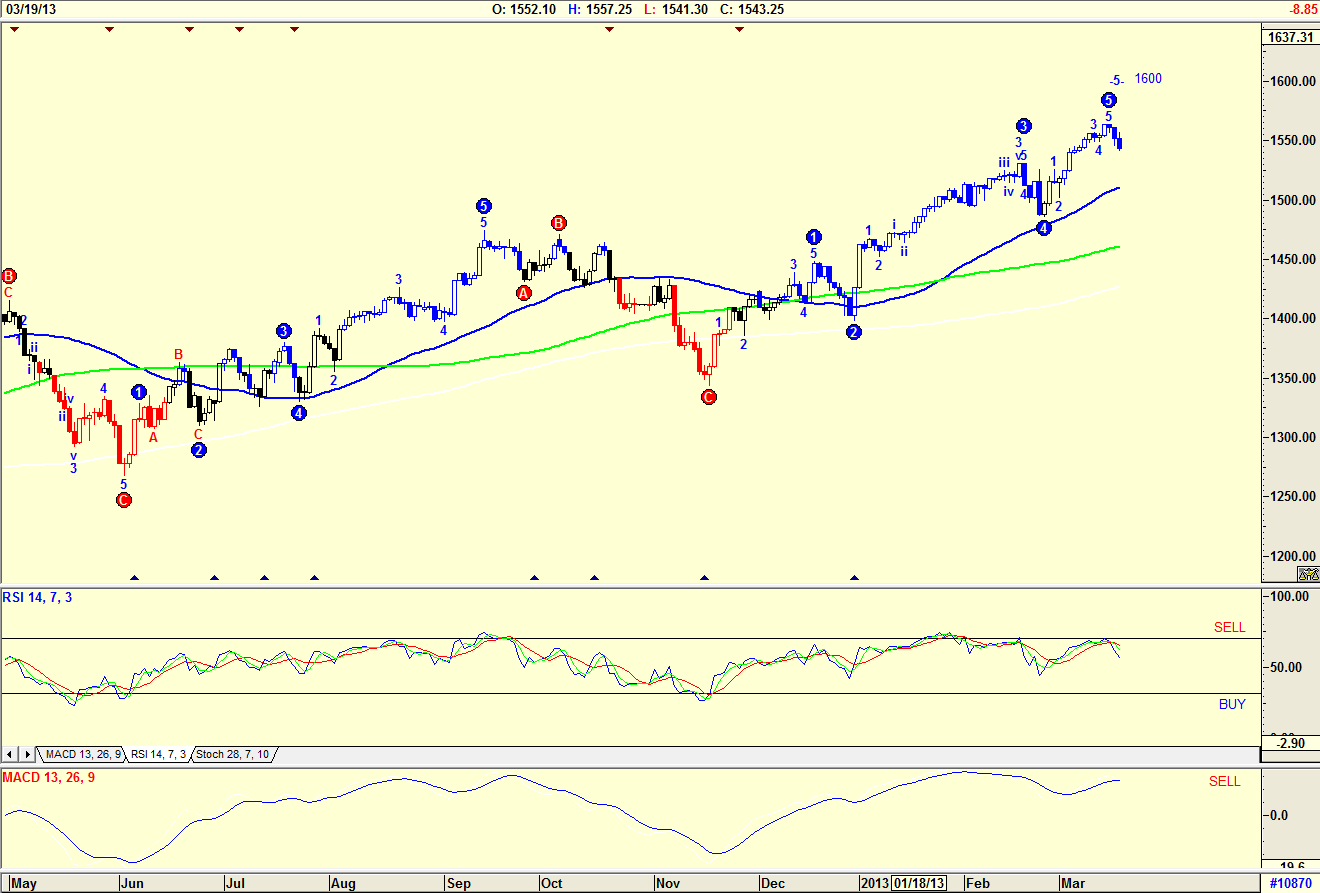
| FIGURES 2. Daily chart of the S&P 500 index. |
| Graphic provided by: AdvancedGET. |
| |
| The chart in Figure 2 is a chart of the Daily S&P500 Index. The Elliott Wave count, once again an Advanced GET program count, is suggesting that the Index has completed a Wave 5, and should now correct in a major ABC correction. The count does suggest that Wave 5 is not definite, with a possible target of 1600. This could occur if the Dow forecast of a Wave 4 correction is genuine. The Elliott Wave count of the S&P500 Index may then change. The RSI indicator did not rise above the 70 level, and then fall giving a sell signal, but the MACD indicator is suggesting a sell signal. We will therefore see the index correct in line with the Dow, with a change in count as the correction looks for a turning point. |

|
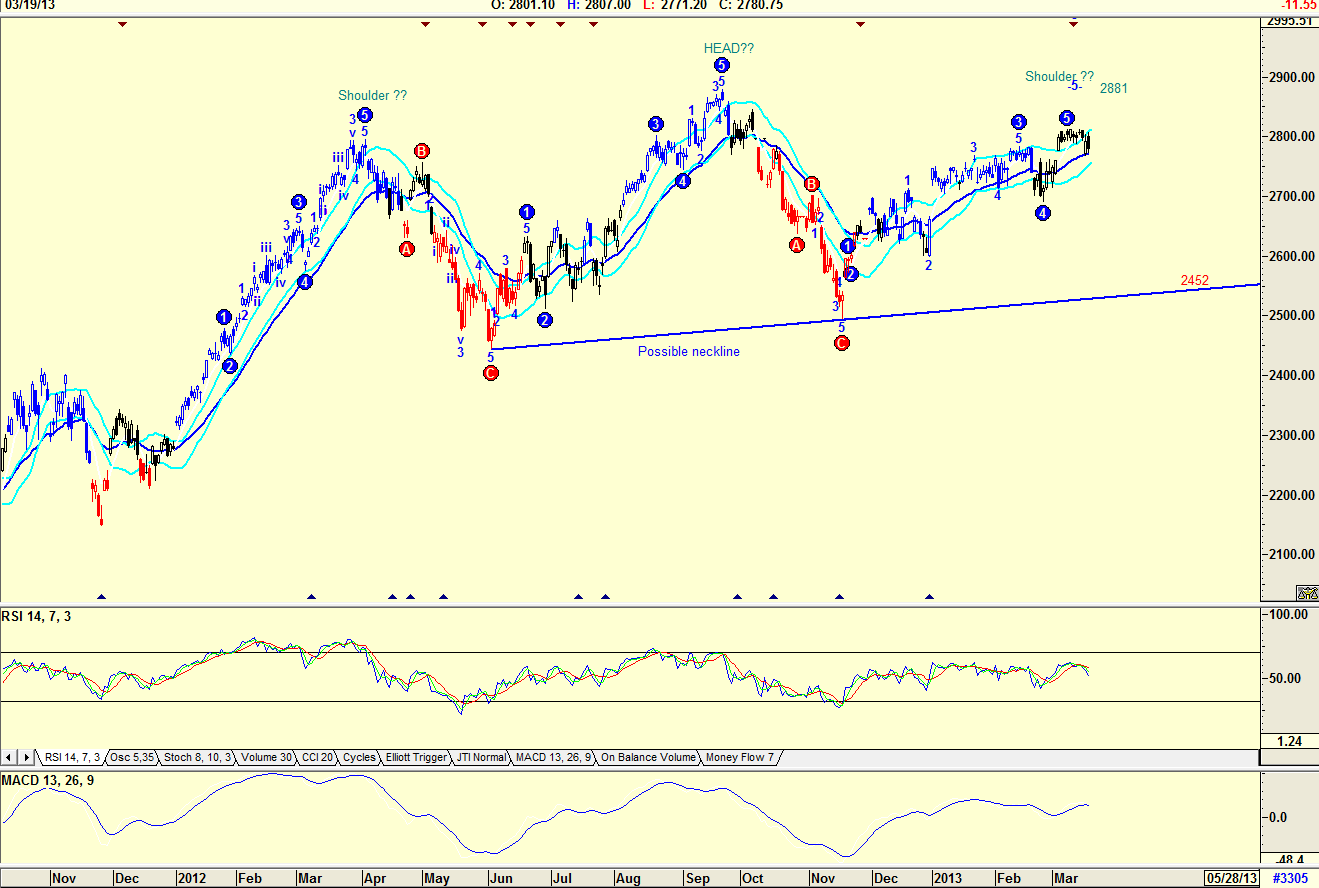
| FIGURE 3. Daily chart of the Nasdaq index. |
| Graphic provided by: AdvancedGET. |
| |
| The Advanced GET Elliott Wave correction is confusing, and does not follow the first rule of Elliott Wave theory, that is, "The chart must look right." The pattern however appears to be developing into a head and shoulders pattern, which is very bearish. But this pattern will only be confirmed should the index drop below the neckline, in the region of 2452. The RSI indicator has not given a sell signal, but the MACD indicator has. All three charts of the main indexes look as though a correction is on the cards. The question is whether this is the start of the sell in May correction, or a correction offering you an opportunity to buy and the take profits as you move into May. The charts are suggesting that caution prevails, and like that Elliott Wave signpost, the counts could change at anytime, so walk down the road carefully and look out for the next signpost. |
Has been a technical analyst since 1969, and has worked as a futures and options trader with First Financial Futures in Johannesburg, South Africa.
| Address: | 3256 West 24th Ave |
| Vancouver, BC | |
| Phone # for sales: | 6042634214 |
| E-mail address: | petroosp@gmail.com |
Click here for more information about our publications!
PRINT THIS ARTICLE

Request Information From Our Sponsors
- StockCharts.com, Inc.
- Candle Patterns
- Candlestick Charting Explained
- Intermarket Technical Analysis
- John Murphy on Chart Analysis
- John Murphy's Chart Pattern Recognition
- John Murphy's Market Message
- MurphyExplainsMarketAnalysis-Intermarket Analysis
- MurphyExplainsMarketAnalysis-Visual Analysis
- StockCharts.com
- Technical Analysis of the Financial Markets
- The Visual Investor
- VectorVest, Inc.
- Executive Premier Workshop
- One-Day Options Course
- OptionsPro
- Retirement Income Workshop
- Sure-Fire Trading Systems (VectorVest, Inc.)
- Trading as a Business Workshop
- VectorVest 7 EOD
- VectorVest 7 RealTime/IntraDay
- VectorVest AutoTester
- VectorVest Educational Services
- VectorVest OnLine
- VectorVest Options Analyzer
- VectorVest ProGraphics v6.0
- VectorVest ProTrader 7
- VectorVest RealTime Derby Tool
- VectorVest Simulator
- VectorVest Variator
- VectorVest Watchdog
