

HOT TOPICS LIST
- MACD
- Fibonacci
- RSI
- Gann
- ADXR
- Stochastics
- Volume
- Triangles
- Futures
- Cycles
- Volatility
- ZIGZAG
- MESA
- Retracement
- Aroon
INDICATORS LIST
LIST OF TOPICS
PRINT THIS ARTICLE
by Matt Blackman
As stocks continue to set new highs, there are some signs emerging to keep traders on their toes.
Position: N/A
Matt Blackman
Matt Blackman is a full-time technical and financial writer and trader. He produces corporate and financial newsletters, and assists clients in getting published in the mainstream media. He is the host of TradeSystemGuru.com. Matt has earned the Chartered Market Technician (CMT) designation. Find out what stocks and futures Matt is watching on Twitter at www.twitter.com/RatioTrade
PRINT THIS ARTICLE
MOVING AVERAGES
Two Charts That Matter
03/19/13 12:48:57 PMby Matt Blackman
As stocks continue to set new highs, there are some signs emerging to keep traders on their toes.
Position: N/A
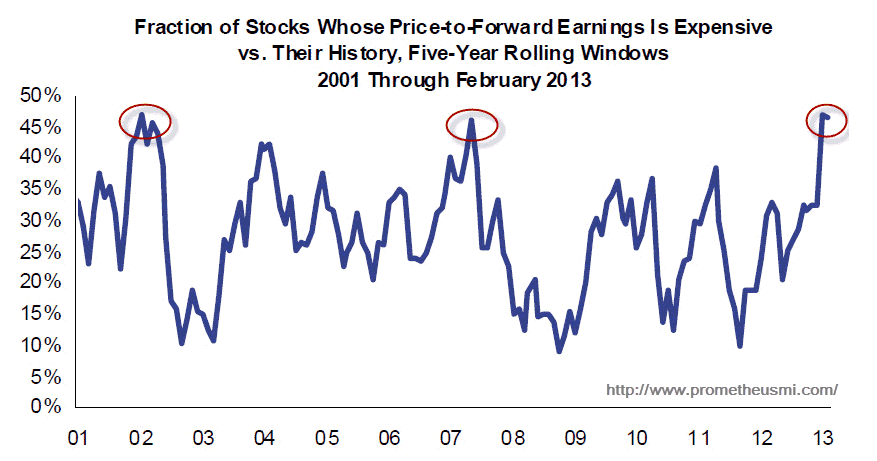
| In a strong bull market, stocks can continue to rally much longer than many expect. This often occurs even though traditional oscillators such as the RSI and stochastics remain overbought for weeks or even months. Sooner or later, some event will trigger a correction and the longer the rally has lasted, the more severe the correction. Here are two fundamental indicators shown in a technical light that should make traders sit up and pay attention. The first comes from Prometheus Market Insights (www.Prometheusmi.com) and shows the fraction of stocks whose price to forward earnings is expensive relative to their five-year rolling averages. As Figure 1 shows, previous peaks occurred in late 2001 and mid-2007, both of which preceded recessions. |
|
| Figure 1 � Chart showing the fraction of stocks where their price-to-forward earnings is expensive relative to their five-year moving averages. Although these peaks come sooner in some cases than others, they are signals that should be heeded. |
| Graphic provided by: Prometheusmi.com. |
| |
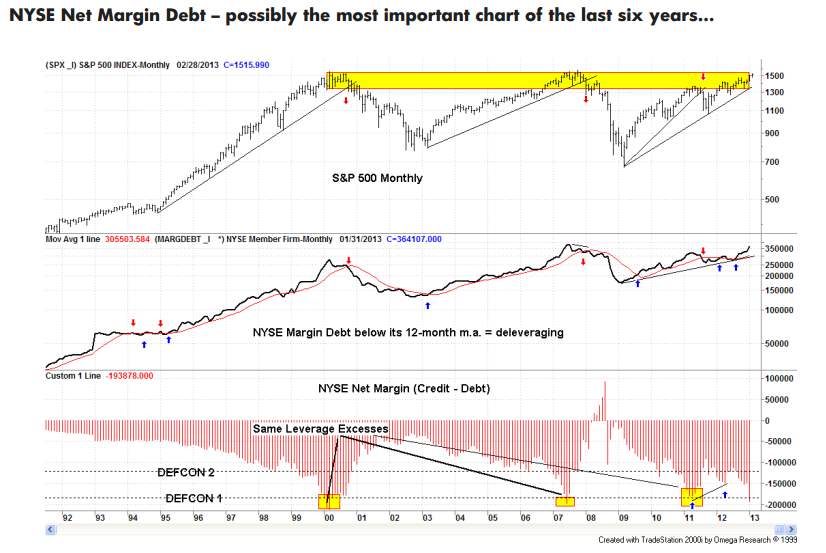
| It's interesting to see the similarities between Figure 1 and Figure 2. Figure 2 shows NYSE net margin debt compared to the S&P500 Index and is from Riccardo Ronco of Aviate Global, by way of Mebane Faber in his ideafarm.com newsletter. Here is how Ricardo explains Figure 2. "Whilst having margin debt above the 12-month average is bullish for the overall market (data have a lag of two months), I have used the net margin to spot excesses in the past that have led to crucial turning points. As it stands, the net margin debt is now well above the peak reached in 2011 and almost on par with the 2007 one. We could have, of course, even higher readings: the only question I dare to bring to your attention is the one of sustainability of such trend/condition of leverage. If history will repeat itself, the end of this 2009 bull market will have consequences similar to the 2000-2003 and 2007-2009, if not worse." |
|
| Figure 2 � Here you see NYSE net margin debt showing peaks in late 2000 and mid-2007 with steady growth into the yellow band toward another peak in 2013. Note the smaller peak in 2011 was followed by a correction which was minor compared to the corrections following the other two peaks. |
| Graphic provided by: aviateglobal.com and theideafarm.com. |
| |
| It is important to point out that both charts being close to their previous peaks does not mean another correction is necessarily imminent - it could come in weeks or months. Figure 1 shows a peak in late 2001 while Figure 2 peaked in early 2000. In 2007, Figure 1 and Figure 2 peaked months before stocks began a significant correction. |
| Although these charts don't tell us exactly when the next correction will hit, we should still prepare for it so as not to be caught off guard when it arrives. |
Matt Blackman is a full-time technical and financial writer and trader. He produces corporate and financial newsletters, and assists clients in getting published in the mainstream media. He is the host of TradeSystemGuru.com. Matt has earned the Chartered Market Technician (CMT) designation. Find out what stocks and futures Matt is watching on Twitter at www.twitter.com/RatioTrade
| Company: | TradeSystemGuru.com |
| Address: | Box 2589 |
| Garibaldi Highlands, BC Canada | |
| Phone # for sales: | 604-898-9069 |
| Fax: | 604-898-9069 |
| Website: | www.tradesystemguru.com |
| E-mail address: | indextradermb@gmail.com |
Traders' Resource Links | |
| TradeSystemGuru.com has not added any product or service information to TRADERS' RESOURCE. | |
Click here for more information about our publications!
Comments

Request Information From Our Sponsors
- StockCharts.com, Inc.
- Candle Patterns
- Candlestick Charting Explained
- Intermarket Technical Analysis
- John Murphy on Chart Analysis
- John Murphy's Chart Pattern Recognition
- John Murphy's Market Message
- MurphyExplainsMarketAnalysis-Intermarket Analysis
- MurphyExplainsMarketAnalysis-Visual Analysis
- StockCharts.com
- Technical Analysis of the Financial Markets
- The Visual Investor
- VectorVest, Inc.
- Executive Premier Workshop
- One-Day Options Course
- OptionsPro
- Retirement Income Workshop
- Sure-Fire Trading Systems (VectorVest, Inc.)
- Trading as a Business Workshop
- VectorVest 7 EOD
- VectorVest 7 RealTime/IntraDay
- VectorVest AutoTester
- VectorVest Educational Services
- VectorVest OnLine
- VectorVest Options Analyzer
- VectorVest ProGraphics v6.0
- VectorVest ProTrader 7
- VectorVest RealTime Derby Tool
- VectorVest Simulator
- VectorVest Variator
- VectorVest Watchdog