

HOT TOPICS LIST
- MACD
- Fibonacci
- RSI
- Gann
- ADXR
- Stochastics
- Volume
- Triangles
- Futures
- Cycles
- Volatility
- ZIGZAG
- MESA
- Retracement
- Aroon
INDICATORS LIST
LIST OF TOPICS
PRINT THIS ARTICLE
by Donald W. Pendergast, Jr.
Shares of Kinross Gold Corp. appear to have already made a major low and may soon break higher.
Position: N/A
Donald W. Pendergast, Jr.
Freelance financial markets writer and online publisher of the Trendzetterz.com S&P 500 Weekly Forecast service.
PRINT THIS ARTICLE
REL. STR COMPARATIVE
KGC: Ready To Break Higher?
03/19/13 12:40:29 PMby Donald W. Pendergast, Jr.
Shares of Kinross Gold Corp. appear to have already made a major low and may soon break higher.
Position: N/A
| Gold and silver mining stocks continue to manifest price action consistent with a major low, and shares of Kinross Gold Corp. (KGC) may be among the first of this beaten-down group to make a decisive break higher. After enduring a nearly 34% decline from early October 2012 to late February 2013, it is doubtful that anyone but a diehard gold bug is about to predict the start of a major bull run in KGC, but for most swing traders who are content making a few percentage points per trade, KGC's current bullish setup will likely be just what they were looking for. Here's a closer look. |
|
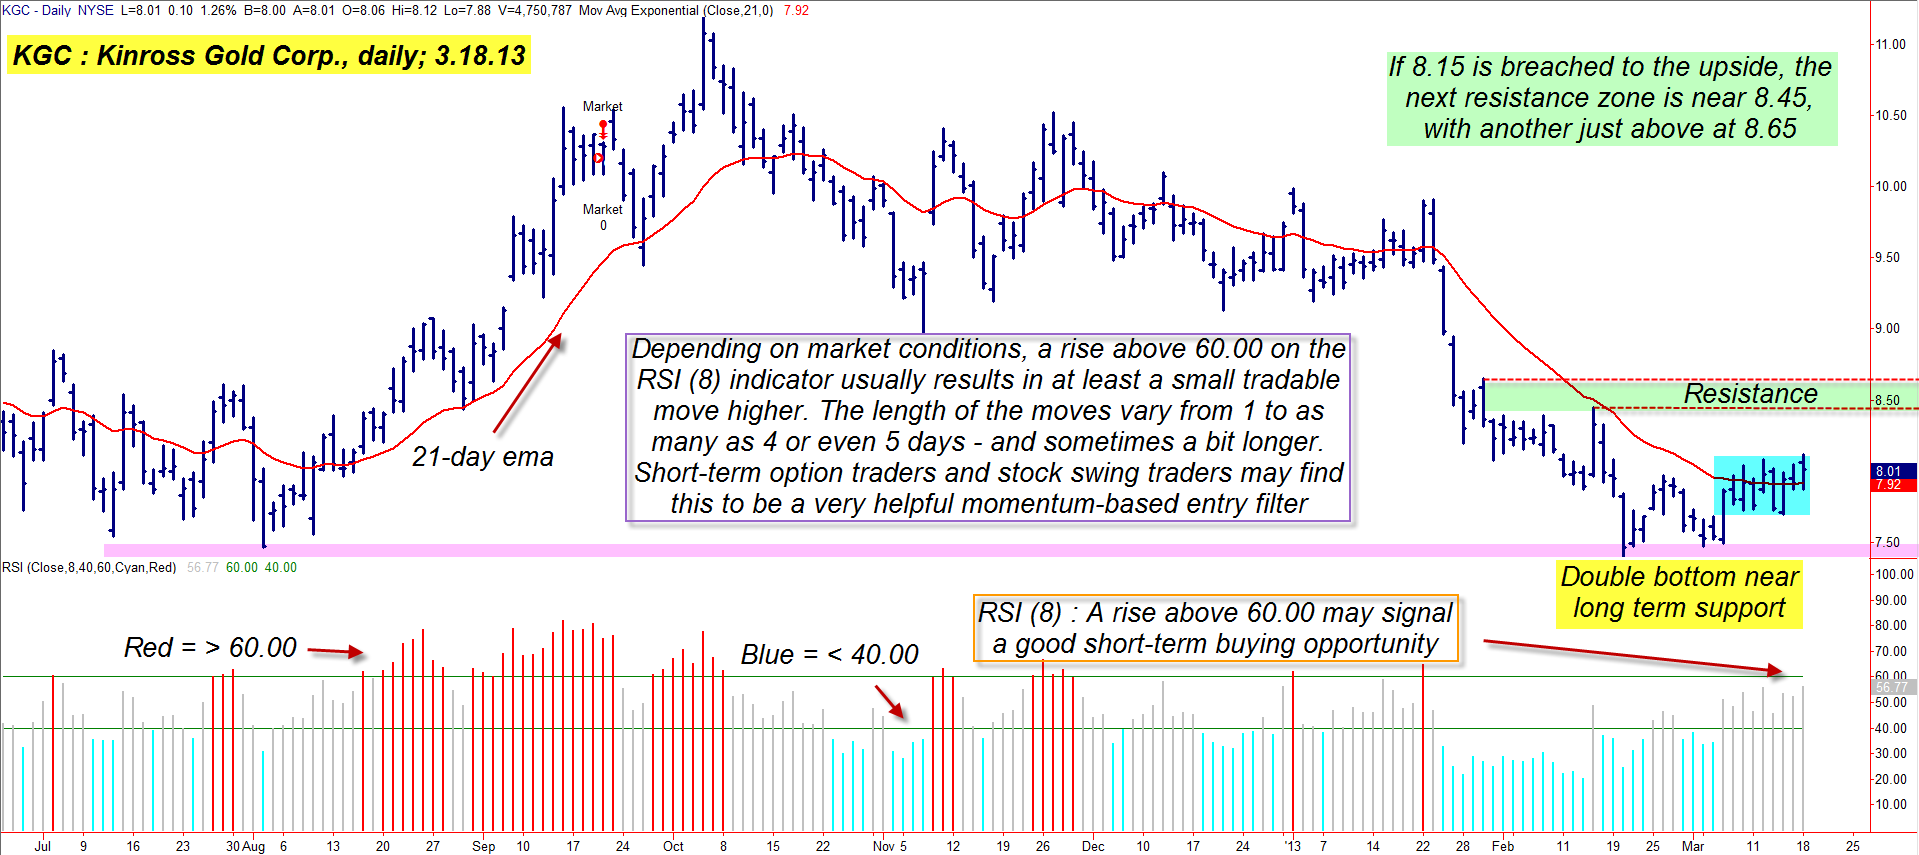
| Figure 1: KGC's latest bullish rectangle (blue area) occurs after two successful tests of support and the completion of a major multicycle low. |
| Graphic provided by: TradeStation. |
| |
| On KGC's daily chart in Figure 1 you will notice only two technical indicators: 1. An 8-day RSI indicator set to 60 for overbought and 40 for oversold. 2. A 21-day exponential moving average (EMA). While this may sound ridiculous, it is all some traders need to help time entries into a swing trade - long or short. They may also use fundamental research, money flow analysis, relative strength comparison and a visual analysis of the stock's long-term trading history (to ensure that it has enough volatility to make swing trading profitable), but as far as 'lines on the trading screen' these two indicators do a good job of alerting traders to potential breakouts - the kind that can result in a rally lasting anywhere from one day to as many as seven days, if not longer. You can see that when the RSI(8) exceeds 60 or declines below 40 (end of day basis) that KGC will typically have more follow through in the same direction over the next several sessions. There are times, however, when the stock makes a "next-day favorable move" only to give most if not all of the open gains back within one session. Obviously, the use of a modest profit target and/or a scaling out strategy would be of immense value when this kind of momentum-based entry trigger is used, since there is no way to know beforehand which trades will be big gainers and which will be flash in the pan failures. |
|
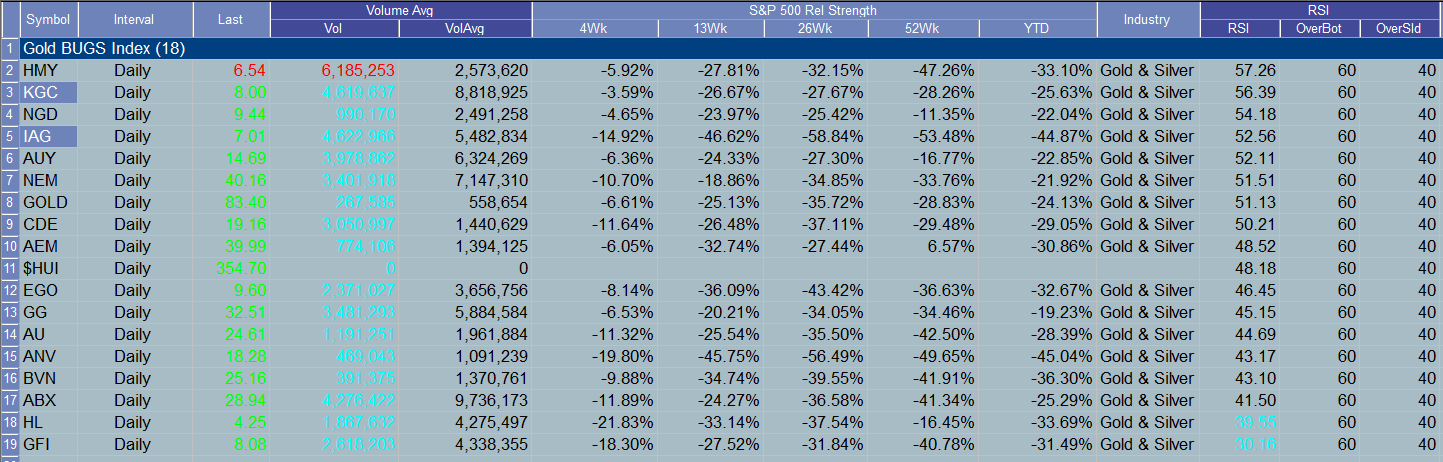
| Figure 2: Kinross Gold Corp. (KGC) has the best 4-week comparative relative strength among gold mining stocks against the .SPX. |
| Graphic provided by: TradeStation. |
| Graphic provided by: TradeStation Radar Screen. |
| |
| Since KGC has a reasonably good tendency to make profitable multiday swings and since it also has the strongest four-week relative strength ranking vs. the .SPX (Figure 2) among its peers in the Gold Bugs index (.HUI), it will likely be one of the first stocks we examine if we are anticipating a bullish reversal in this hard-hit group. When we load our chart we see several bullish chart patterns at work: 1. A recent double bottom (DB) pattern 2. The DB formed at the long term support level near 7.50 (green line). 3. After rising up from the DB, KGC is now in a small rectangle pattern (blue area), one that has a bullish bias baked into it, given the two recent successful tests of major support and that a major multicycle low appears to have already been made by the stock. |
| As mentioned, KGC has the top four-week RS ranking against the .SPX for its group, so it appears that we have an attractive bullish breakout candidate here; all that's left is to wait for an entry trigger, one that will arrive the day after KGC's RSI(8) makes a daily close above 60.00. If or when that occurs, place a buy stop above the high of the price bar that caused the RSI to exceed 60.00 and wait for the market to move far enough to fill your order. If filled, running a two-bar trailing stop of the daily lows can help keep you in the trade without losing too much money if things go awry; risk no more than 1% of your account on these types of short-term breakout setups just to be on the safe side. You might also want to set a close initial profit target for a portion of the position, too, thus reducing your trade risk as the stock moves higher. This isn't the most complex trading strategy in the world, but if you have a good eye for chart patterns and can locate stocks with good swing potential, you may find that this basic template is a great starting point for your trading journey. Trade wisely until we meet here again. |
Freelance financial markets writer and online publisher of the Trendzetterz.com S&P 500 Weekly Forecast service.
| Title: | Market consultant and writer |
| Company: | Trendzetterz |
| Address: | 81 Hickory Hollow Drive |
| Crossville, TN 38555 | |
| Phone # for sales: | 904-303-4814 |
| Website: | trendzetterz.com |
| E-mail address: | support@trendzetterz.com |
Traders' Resource Links | |
| Trendzetterz has not added any product or service information to TRADERS' RESOURCE. | |
Click here for more information about our publications!
Comments

Request Information From Our Sponsors
- StockCharts.com, Inc.
- Candle Patterns
- Candlestick Charting Explained
- Intermarket Technical Analysis
- John Murphy on Chart Analysis
- John Murphy's Chart Pattern Recognition
- John Murphy's Market Message
- MurphyExplainsMarketAnalysis-Intermarket Analysis
- MurphyExplainsMarketAnalysis-Visual Analysis
- StockCharts.com
- Technical Analysis of the Financial Markets
- The Visual Investor
- VectorVest, Inc.
- Executive Premier Workshop
- One-Day Options Course
- OptionsPro
- Retirement Income Workshop
- Sure-Fire Trading Systems (VectorVest, Inc.)
- Trading as a Business Workshop
- VectorVest 7 EOD
- VectorVest 7 RealTime/IntraDay
- VectorVest AutoTester
- VectorVest Educational Services
- VectorVest OnLine
- VectorVest Options Analyzer
- VectorVest ProGraphics v6.0
- VectorVest ProTrader 7
- VectorVest RealTime Derby Tool
- VectorVest Simulator
- VectorVest Variator
- VectorVest Watchdog