HOT TOPICS LIST
- MACD
- Fibonacci
- RSI
- Gann
- ADXR
- Stochastics
- Volume
- Triangles
- Futures
- Cycles
- Volatility
- ZIGZAG
- MESA
- Retracement
- Aroon
INDICATORS LIST
LIST OF TOPICS
PRINT THIS ARTICLE
by Koos van der Merwe
The Relative Strength Index (RSI) developed by Welles Wilder is considered to be a core indicator in technical analysis.
Position: Buy
Koos van der Merwe
Has been a technical analyst since 1969, and has worked as a futures and options trader with First Financial Futures in Johannesburg, South Africa.
PRINT THIS ARTICLE
RSI
Trusting The RSI Index
03/18/13 02:40:59 PMby Koos van der Merwe
The Relative Strength Index (RSI) developed by Welles Wilder is considered to be a core indicator in technical analysis.
Position: Buy
| Here are some quotes by Welles Wilder: a. "Letting your emotions override your plan or system is the biggest cause of failure." b. "Some traders are born with an innate discipline. Most have to learn it the hard way." c."If you can't deal with emotion, get out of trading." So, the best thing to do is follow the RSI indicator, and do what it tells you to do. With this in mind, does it mean that now is the time to start buying gold shares? Let us have a look at the chart of Agnico-Eagle Mines, Ltd. (AEM-T) to answer that question. |

|
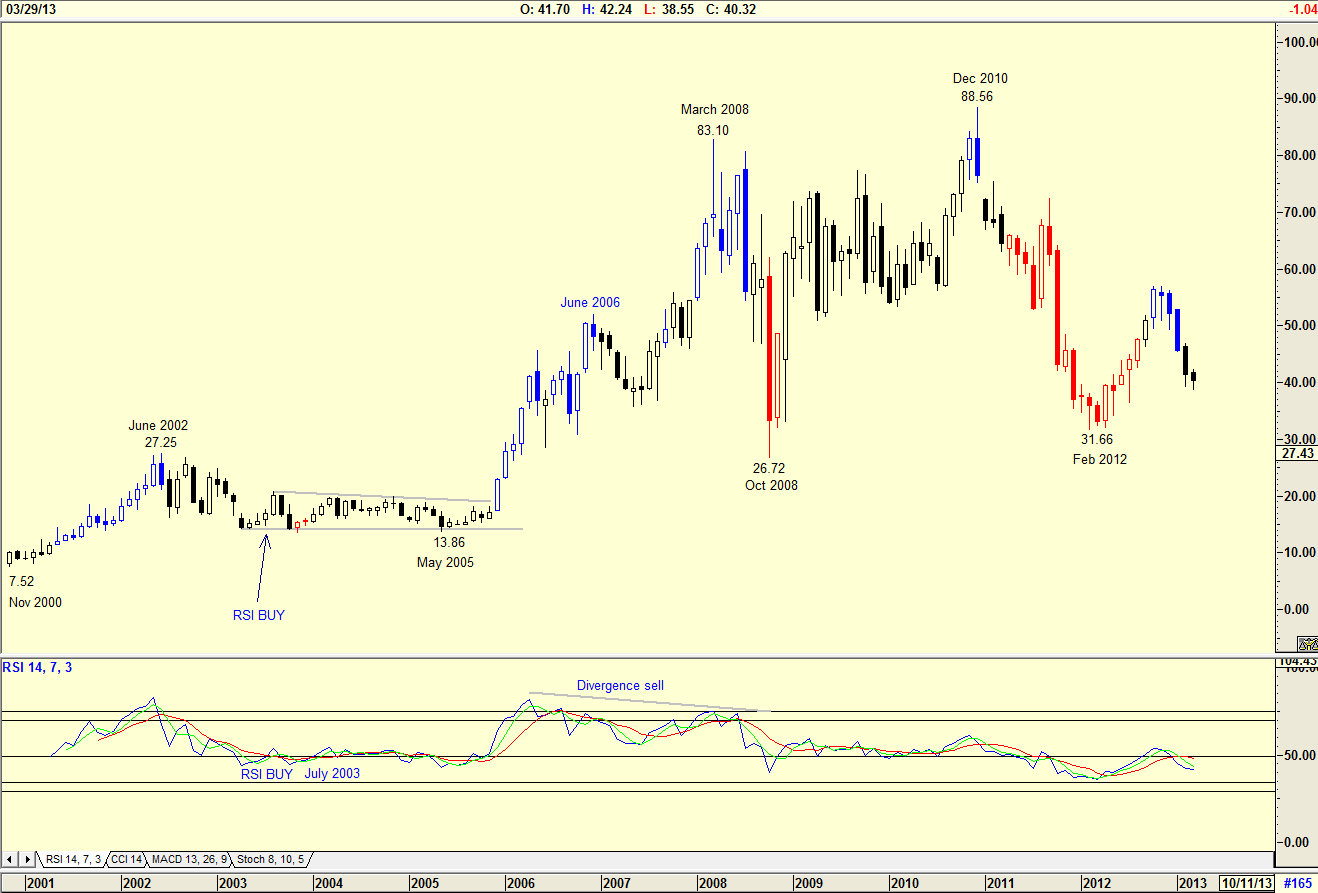
| Figure 1. Monthly chart showing RSI signals. |
| Graphic provided by: AdvancedGET. |
| |
| The monthly chart of AEM-T in Figure 1 shows how the price rose from a low of $7.52 in November 2000 to a high of $88.56 by December 2010. The RSI indicator suggested a buy in July 2003 when the price was $13.86. The indicator did not fall below the 32 horizontal, which is the level Wilder suggested should trigger a buy. It was only in May 2005 that the price started moving up and strongly confirmed that buy. Having patience for two years with an RSI signal can be a bit frustrating. Note how the RSI gave an early sell signal in June 2006, but developed into a divergence sell signal by March 2008 -- another two years of frustration. A divergence sell signal is where the price makes a higher high while the RSI indicator makes a lower high. The RSI indicator on a monthly chart should be looked at purely for guidance. |

|
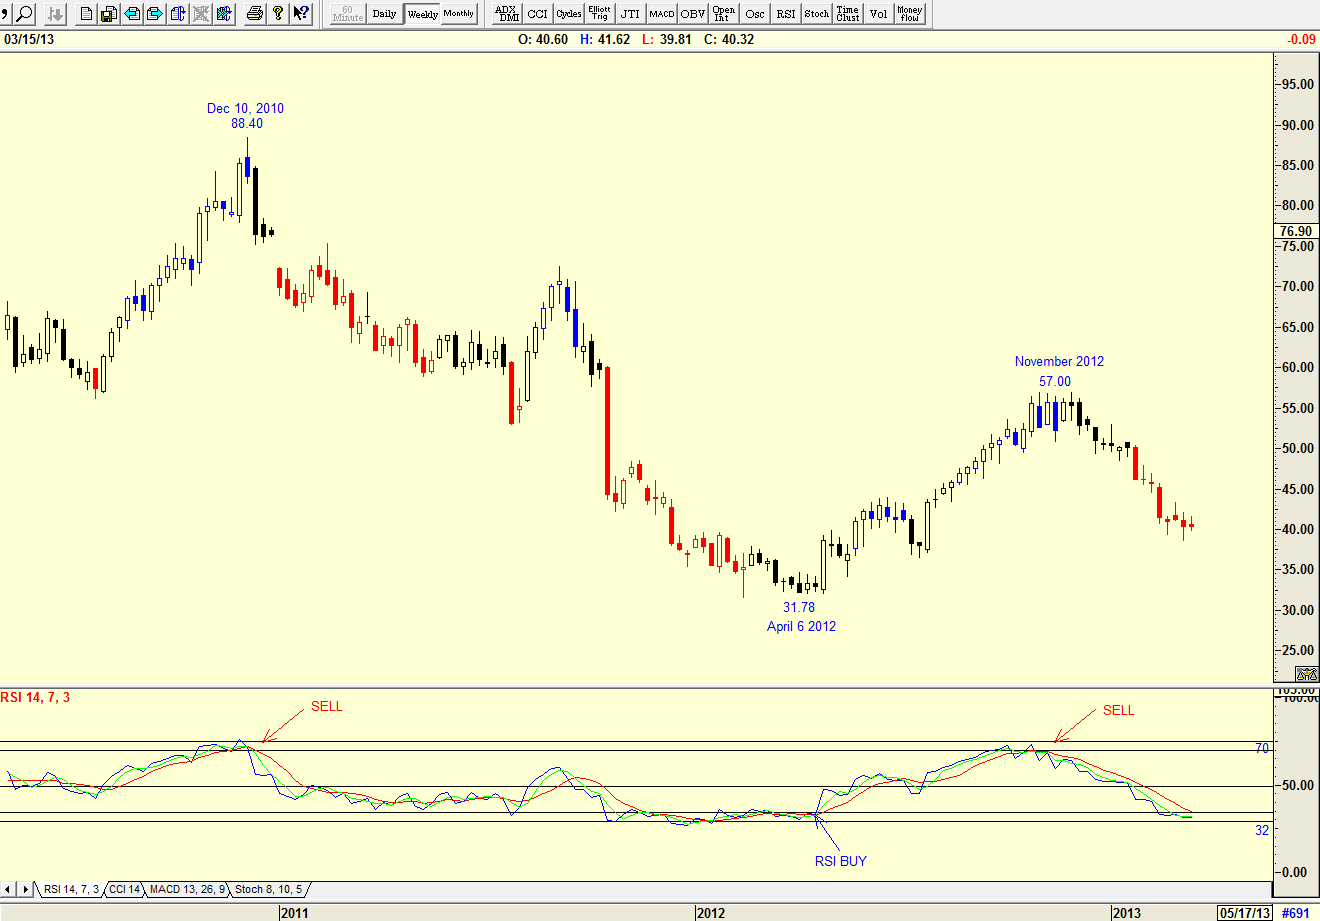
| Figure 2. Weekly Chart showing RSI signals |
| Graphic provided by: AdvancedGET. |
| |
| Looking at the weekly chart in Figure 2, you can see that the RSI indicator has become more effective giving a sell signal in December 2010 when the price was $88.40, and a buy signal in April 6, 2012 when the price was $31.78. In November 2012 with the price at $57, the RSI gave another successful sell signal. At the moment the RSI is almost below the 32 level, but has not yet given a buy signal. With the RSI at this level, you must look at the daily chart. |

|
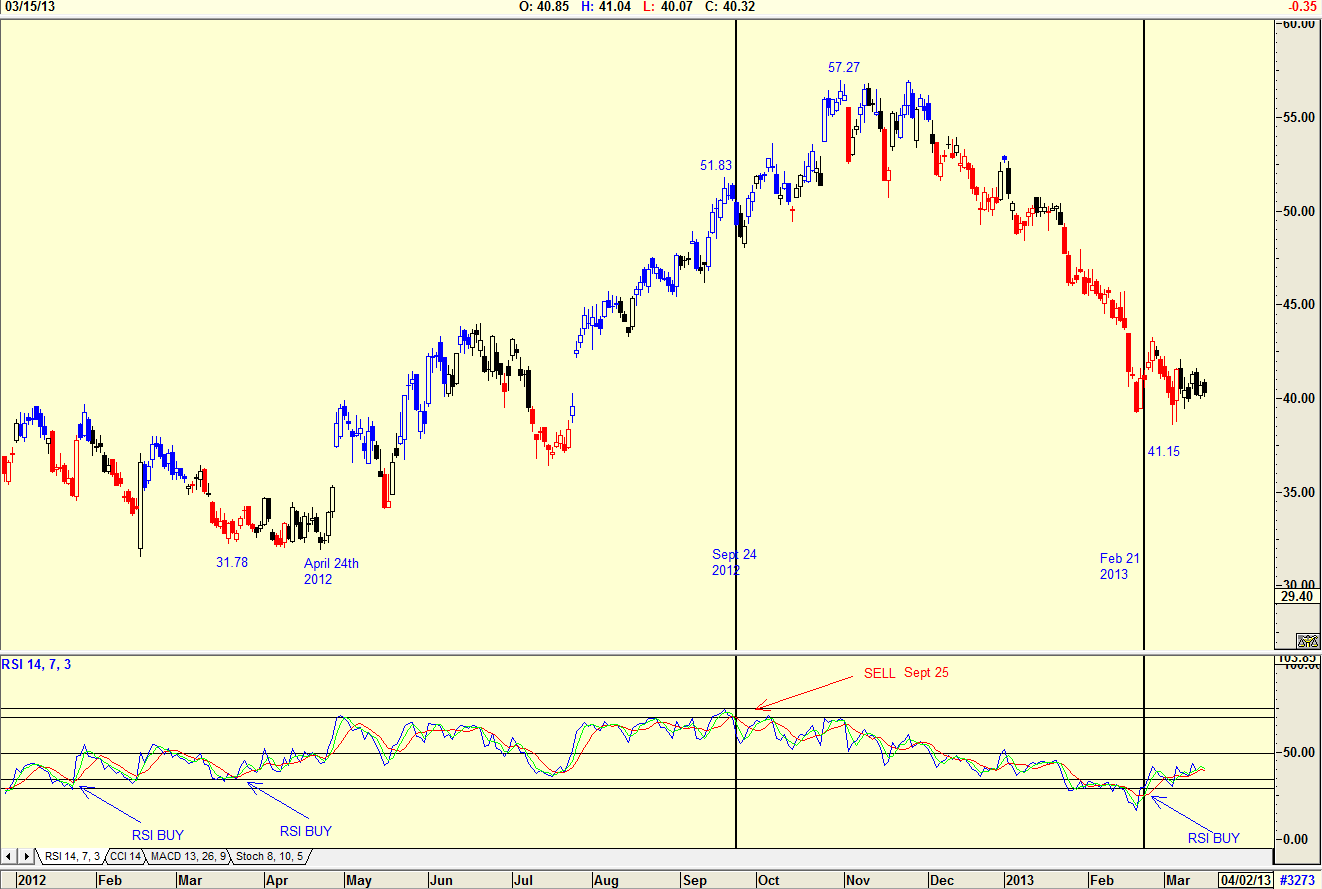
| Figure 3. Daily chart with RSI signals. |
| Graphic provided by: AdvancedGET. |
| |
| The daily chart in Figure 3 shows the RSI buy/sell indicators given by the RSI indicator, all a bit earlier than the top reached by the price. But isn't the first rule of trading the market to always buy into strength, and sell into strength? Buying and selling using the RSI indicator is a plus. Use the weekly chart with the RSI to suggest your entries and exits but use the daily chart to confirm those points. |
Has been a technical analyst since 1969, and has worked as a futures and options trader with First Financial Futures in Johannesburg, South Africa.
| Address: | 3256 West 24th Ave |
| Vancouver, BC | |
| Phone # for sales: | 6042634214 |
| E-mail address: | petroosp@gmail.com |
Click here for more information about our publications!
Comments

|

Request Information From Our Sponsors
- StockCharts.com, Inc.
- Candle Patterns
- Candlestick Charting Explained
- Intermarket Technical Analysis
- John Murphy on Chart Analysis
- John Murphy's Chart Pattern Recognition
- John Murphy's Market Message
- MurphyExplainsMarketAnalysis-Intermarket Analysis
- MurphyExplainsMarketAnalysis-Visual Analysis
- StockCharts.com
- Technical Analysis of the Financial Markets
- The Visual Investor
- VectorVest, Inc.
- Executive Premier Workshop
- One-Day Options Course
- OptionsPro
- Retirement Income Workshop
- Sure-Fire Trading Systems (VectorVest, Inc.)
- Trading as a Business Workshop
- VectorVest 7 EOD
- VectorVest 7 RealTime/IntraDay
- VectorVest AutoTester
- VectorVest Educational Services
- VectorVest OnLine
- VectorVest Options Analyzer
- VectorVest ProGraphics v6.0
- VectorVest ProTrader 7
- VectorVest RealTime Derby Tool
- VectorVest Simulator
- VectorVest Variator
- VectorVest Watchdog
