

HOT TOPICS LIST
- MACD
- Fibonacci
- RSI
- Gann
- ADXR
- Stochastics
- Volume
- Triangles
- Futures
- Cycles
- Volatility
- ZIGZAG
- MESA
- Retracement
- Aroon
INDICATORS LIST
LIST OF TOPICS
PRINT THIS ARTICLE
by Donald W. Pendergast, Jr.
Small cap stocks just keep on rising, and with the Russell 2000 index now at fresh multiyear highs, now is a good time to estimate when its next cycle high will appear.
Position: N/A
Donald W. Pendergast, Jr.
Freelance financial markets writer and online publisher of the Trendzetterz.com S&P 500 Weekly Forecast service.
PRINT THIS ARTICLE
CYCLES
Russell 2000 Index: Cycle High Due In April 2013
03/18/13 02:33:28 PMby Donald W. Pendergast, Jr.
Small cap stocks just keep on rising, and with the Russell 2000 index now at fresh multiyear highs, now is a good time to estimate when its next cycle high will appear.
Position: N/A
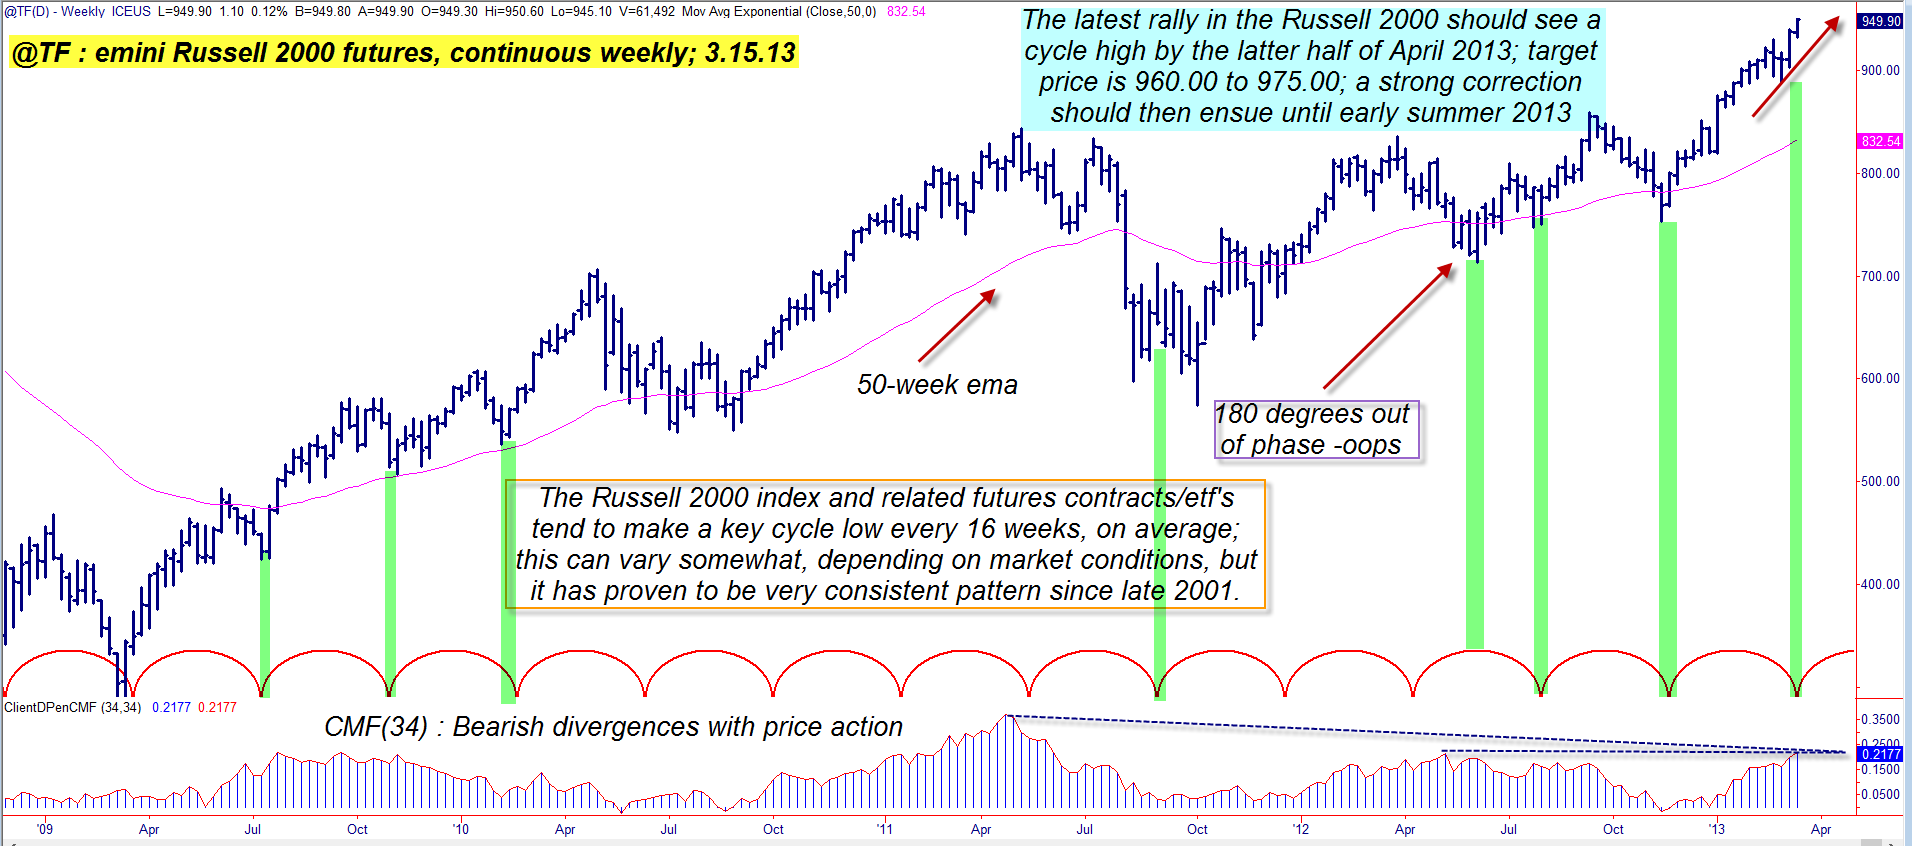
| Since it bottomed at 290.80 on March 9, 2009, the Russell 2000 index (.RUT, aka: R2K) has risen by more than 226% (as of this writing). There have been several large-scale corrections over the past four years since that major low was made, of course, but each time, this key small cap stock index has come roaring back. Price cycle analysis can sometimes be a great help in preparing for a market's next key turn and in this article we will look at a simple yet repetitive cycle that continues to be very consistent in its ability to help traders stay one step ahead of the R2K. Here's a closer look. |
|
| Figure 1: While the 16-week timing between major swing lows has been very reliable since late 2001, at times the cycle will invert (be out of phase) by a full 180 degrees. Cycle analysis should always be used with a variety of other technical and fundamental studies before putting on trades. |
| Graphic provided by: TradeStation. |
| |
| In TradeStation 9.1 and many other trading/charting platforms, such as Metastock 12, and Ensign, you can avail yourself of a time or price cycle drawing tool, that can help you visually confirm the existence of repetitive price cycles in the stocks and indexes you regularly trade or analyze. From my own experience with several cycles-based software programs, cycle analysis seems to be more reliable when applied to stock indexes instead of individual stocks, although there are still many good reasons to use cycle studies when helping time your next equity trade. On the weekly chart of the Russell 2000 futures (continuous contract) in Figure 1, a 16-week price cycle has been identified; the cycle start point was November 2, 2001. It is remarkable how often this cycle repeats in this small-cap index. Sometimes the cycle low (we measure from major swing low to major swing low) is late, coming in at 17-20 weeks. Other times it is a bit early, arriving in as few as 12-15 weeks, but it almost always helps a trader or investor be prepared for the next appearance of a major, tradable low, regardless of if it's a bit behind or ahead of itself. Here are some of the advantages in knowing when the next major cycle low is due in your favorite stock index: 1.If you are already long the market with a basket of stocks and know that a major cycle low is due for the parent stock index within the next four to five weeks, and that it has been almost 12 weeks since its latest rally commenced, you'll be less aggressive in putting on new long positions and will probably also want to trail your stops on your open stock positions a bit more closely. 2. If you're flat (in cash) the market and are looking for a low risk buying zone and know that the .RUT is within one to three weeks of making its next 16-week cycle low, you can begin to prepare your "shopping list" of small-cap stocks you like. This could be based on earnings, products, sales forecasts, and key technicals (support/resistance lines, moving average crossovers, channel breakouts, etc.). When the .RUT finally does bottom out (confirming the cycle low is in place) you can then begin to build your dream portfolio, knowing that the probability of a rally is heavily in your favor. 3. Price cycle studies can be a major boon to skilled option traders, particularly those that sell out-of-the-money (OTM) near-term puts to collect premium. If you see the .RUT begin to reverse higher after descending into the 16-week cycle low zone, you may have a good, low-risk shot at selling a put for some decent amount of cash. If you know how to confirm major support areas, Fibonacci confluences, and key moving average support, the use of cycles analysis should really help your options trading. |
|
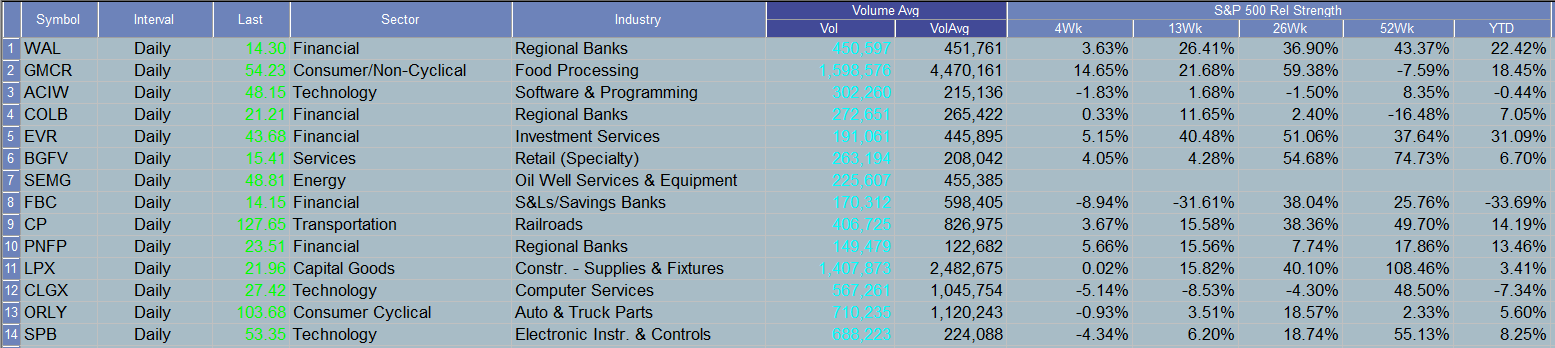
| Figure 2: These small cap stocks have done very well, for the most part, over the past 52 weeks. When the next cycle high (due in April 2013) arrives in the .RUT, however, existing longs in these stocks will hopefully already have begun to scale out and/or have purchased put option protection. |
| Graphic provided by: TradeStation. |
| Graphic provided by: TradeStation Radar Screen. |
| |
| Looking at the weekly .RUT chart, we see that its current 16-week cycle high (top of red arcs) isn't due until the second half of April 2013 and that the most recent 16-week cycle low (W/E March 1, 2013) actually arrived two weeks early. We also find that the 34-week Chaikin Money flow histogram (CMF)(34) is confirming a noticeably bearish divergence with price; these are two modestly bearish clues that may be warning ahead of time that this particular leg higher will stall out a bit ahead of schedule - possibly during the first half of April, if not sooner - and that existing longs in small cap stocks should now be taking active steps to protect their portfolios before the next correction (probably good for at least a 5% - 8% decline by summer 2013). The cycles and money flow patterns are similar for the .SPX, .NDX and .DJIA, so be sure you do what you can now to protect your long equity positions in the market. Now that you have a basic idea of how to analyze price cycles with the free tools available in your existing charting software, you'll be better able to spot low-risk buy zones as well as to better protect your long positions in the market. Trade wisely until we meet here again. |
Freelance financial markets writer and online publisher of the Trendzetterz.com S&P 500 Weekly Forecast service.
| Title: | Market consultant and writer |
| Company: | Trendzetterz |
| Address: | 81 Hickory Hollow Drive |
| Crossville, TN 38555 | |
| Phone # for sales: | 904-303-4814 |
| Website: | trendzetterz.com |
| E-mail address: | support@trendzetterz.com |
Traders' Resource Links | |
| Trendzetterz has not added any product or service information to TRADERS' RESOURCE. | |
Click here for more information about our publications!
PRINT THIS ARTICLE

Request Information From Our Sponsors
- VectorVest, Inc.
- Executive Premier Workshop
- One-Day Options Course
- OptionsPro
- Retirement Income Workshop
- Sure-Fire Trading Systems (VectorVest, Inc.)
- Trading as a Business Workshop
- VectorVest 7 EOD
- VectorVest 7 RealTime/IntraDay
- VectorVest AutoTester
- VectorVest Educational Services
- VectorVest OnLine
- VectorVest Options Analyzer
- VectorVest ProGraphics v6.0
- VectorVest ProTrader 7
- VectorVest RealTime Derby Tool
- VectorVest Simulator
- VectorVest Variator
- VectorVest Watchdog
- StockCharts.com, Inc.
- Candle Patterns
- Candlestick Charting Explained
- Intermarket Technical Analysis
- John Murphy on Chart Analysis
- John Murphy's Chart Pattern Recognition
- John Murphy's Market Message
- MurphyExplainsMarketAnalysis-Intermarket Analysis
- MurphyExplainsMarketAnalysis-Visual Analysis
- StockCharts.com
- Technical Analysis of the Financial Markets
- The Visual Investor