

HOT TOPICS LIST
- MACD
- Fibonacci
- RSI
- Gann
- ADXR
- Stochastics
- Volume
- Triangles
- Futures
- Cycles
- Volatility
- ZIGZAG
- MESA
- Retracement
- Aroon
INDICATORS LIST
LIST OF TOPICS
PRINT THIS ARTICLE
by Donald W. Pendergast, Jr.
With such strong support in the 30.00-31.00 area, might FCX be pulling back one more time before a major rally ensues?
Position: N/A
Donald W. Pendergast, Jr.
Freelance financial markets writer and online publisher of the Trendzetterz.com S&P 500 Weekly Forecast service.
PRINT THIS ARTICLE
DOUBLE BOTTOMS
Freeport-McMoran: More Rally Ahead?
03/15/13 04:40:50 PMby Donald W. Pendergast, Jr.
With such strong support in the 30.00-31.00 area, might FCX be pulling back one more time before a major rally ensues?
Position: N/A
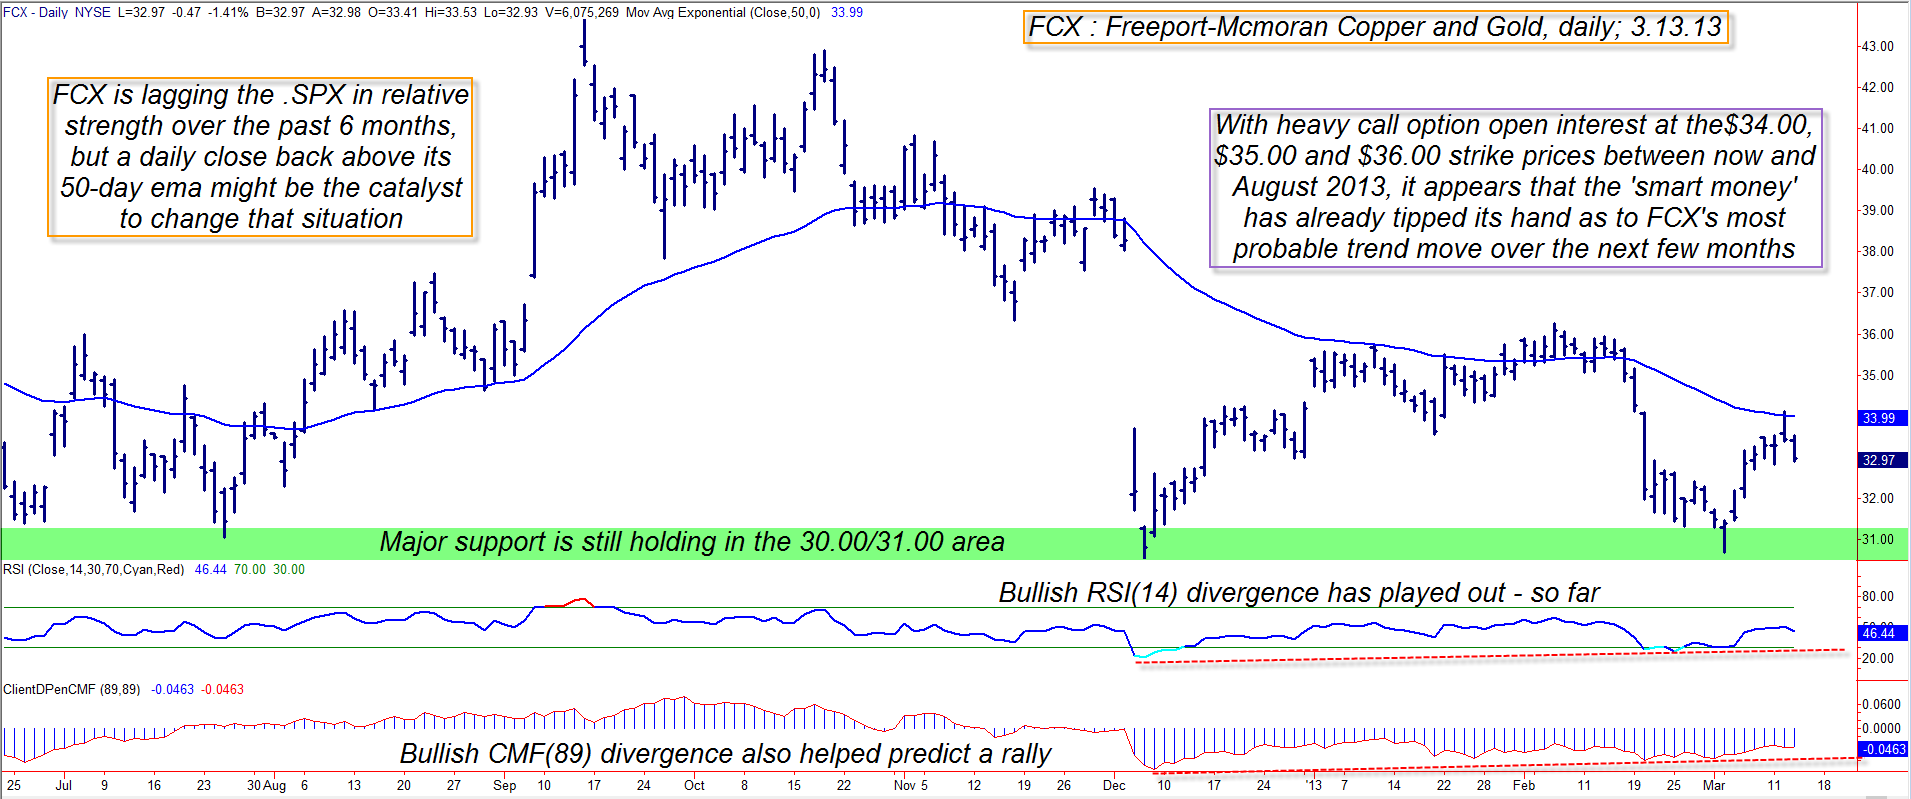
| In a recent TCA article from March 1, 2013 titled "FCX: Close to a Major Turn?" I made the case that Freeport-McMoRan Copper and Gold was near a high probability bullish turning point, as several key price cycles were right on schedule to bottom together. FCX did bottom shortly thereafter at 30.72 before surging to 34.12 during the next six trading sessions and is now pulling back a bit, trading at 33.04 as this is written. The big question now for FCX traders is simply this, "Is this a minor pullback before a larger-degree bullish trend develops or is the stock destined to drop back toward 31.00 before making another attempt at higher prices?" Here's a closer look now at FCX's daily chart for a few clues (Figure 1). |
|
| Figure 1: With such major support near 30.00/31.00 having been tested since mid-2012, several technical and sentiment indicators are making a strong case for more upside in FCX into the spring/summer of 2013. |
| Graphic provided by: TradeStation. |
| |
| Sometimes trading is like watching a pot of water on the stove, waiting for it to come to a boil; you know that if you leave the heat on and wait long enough, you'll have all the boiling water you desire - all it takes is a little patience. In the world of high probability trade setups, we see much of the same dynamics at work (that of time and patience), and although we can never be sure of the final outcome on a trade, many times our analysis turns out close to what we expected, provided we have the mental and emotional staying power to wait for the anticipated move to play out. Such may be the case with FCX now; it's clear that the major multicycle low of March 4, 2013 is indicating that there is a very good chance that this stock will be heading significantly higher in the weeks ahead (to at least the 37.00/38.00 area, if not higher). As far as other key technicals go, the 89-day Chaikin Money flow (CMF)(89) and the RSI(14) indicators had already manifested bullish divergences with price at the time of the March 4, 2013 low and it's little surprise to see how strongly FCX rose during the following week. The stock is less than a dollar shy of its 50-day exponential moving average (EMA) and one hint that FCX is destined to continue to rise will be if it makes a daily close above that key resistance line (near 34.00) within the next few trading sessions; after an initial rally out of a major low, there is usually an attempted 'shakeout' by the strong hands (who are the main drivers of price in any market) in the stock, one that will ideally allow them to accumulate more shares at a better price before the rally resumes. That's likely the case in FCX now, and here's what to look for if you're also anticipating a strong advance in the stock soon: 1. Look for a daily close above the 50-day EMA. 2. Look for other metals mining stocks to also be rising in price. 3. Check to see that the 34-and 89- or 100-day Chaikin Money flow indicators are indicating strong accumulation in the stock. If all of that is a 'go' in the next 7 to 10 days, simply place a buy stop market order to go long FCX a few ticks above the price bar that closed above the 50-day EMA and then start running a three-bar trailing stop of the daily lows until the trade finally stops out; conservative traders might want to consider taking half profits if FCX reaches 36.00/36.25 quickly, as that's a key resistance area to be aware of. |
|
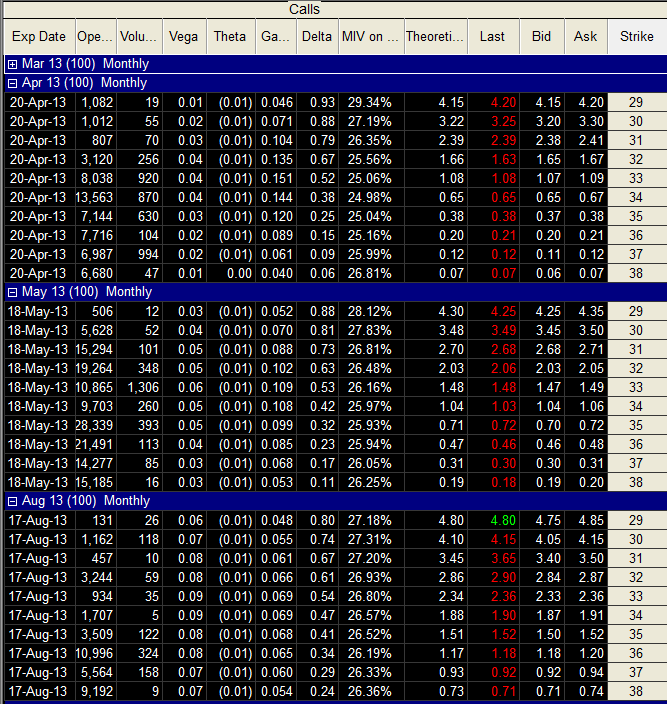
| Figure 2: With tons of call open interest at the $34.00/$35.00/$36.00 strikes between March and August 2013, it appears that the 'big money' players in this stock are heavily invested in seeing FCX's price rise substantially over the next few months. |
| Graphic provided by: TradeStation. |
| Graphic provided by: TradeStation Options Analysis. |
| |
| There is another bullish (and fascinating) aspect to FCX's current chart scenario that traders and investors need to be aware of. Looking at FCX's call option chains between April and August 2013 (Figure 2), a very bullish picture emerges: The April '13 FCX $34.00 calls have over 13,000 contracts open interest, the May '13 $35.00 and $36.00 calls have more than 28,000 and 21,000 contracts open interest (respectively) and the August '13 FCX $36.00 calls have more than 11,000 contracts open interest. Simply put (pardon the pun), the option traders in FCX appear to be confident of a bullish rally heading into the spring/summer of 2013, and they've got tons of dollars invested in FCX calls to back up their bullish prognostications. It is true that sometimes you can use bullish options open interest figures to build a case for a bear move in a stock (using it as a contrary indicator), but given FCX's 'right on' price cycles timing of late, it appears that for now the bulls definitely have the upper hand in this key mining stock. Trade wisely until we meet here again. |
Freelance financial markets writer and online publisher of the Trendzetterz.com S&P 500 Weekly Forecast service.
| Title: | Market consultant and writer |
| Company: | Trendzetterz |
| Address: | 81 Hickory Hollow Drive |
| Crossville, TN 38555 | |
| Phone # for sales: | 904-303-4814 |
| Website: | trendzetterz.com |
| E-mail address: | support@trendzetterz.com |
Traders' Resource Links | |
| Trendzetterz has not added any product or service information to TRADERS' RESOURCE. | |
Click here for more information about our publications!
PRINT THIS ARTICLE

Request Information From Our Sponsors
- VectorVest, Inc.
- Executive Premier Workshop
- One-Day Options Course
- OptionsPro
- Retirement Income Workshop
- Sure-Fire Trading Systems (VectorVest, Inc.)
- Trading as a Business Workshop
- VectorVest 7 EOD
- VectorVest 7 RealTime/IntraDay
- VectorVest AutoTester
- VectorVest Educational Services
- VectorVest OnLine
- VectorVest Options Analyzer
- VectorVest ProGraphics v6.0
- VectorVest ProTrader 7
- VectorVest RealTime Derby Tool
- VectorVest Simulator
- VectorVest Variator
- VectorVest Watchdog
- StockCharts.com, Inc.
- Candle Patterns
- Candlestick Charting Explained
- Intermarket Technical Analysis
- John Murphy on Chart Analysis
- John Murphy's Chart Pattern Recognition
- John Murphy's Market Message
- MurphyExplainsMarketAnalysis-Intermarket Analysis
- MurphyExplainsMarketAnalysis-Visual Analysis
- StockCharts.com
- Technical Analysis of the Financial Markets
- The Visual Investor