

HOT TOPICS LIST
- MACD
- Fibonacci
- RSI
- Gann
- ADXR
- Stochastics
- Volume
- Triangles
- Futures
- Cycles
- Volatility
- ZIGZAG
- MESA
- Retracement
- Aroon
INDICATORS LIST
LIST OF TOPICS
PRINT THIS ARTICLE
by Donald W. Pendergast, Jr.
Shares of Gilead Sciences, Inc. have been in a long-term bull market for several years, but warnings of a bearish trend reversal are now in place.
Position: N/A
Donald W. Pendergast, Jr.
Freelance financial markets writer and online publisher of the Trendzetterz.com S&P 500 Weekly Forecast service.
PRINT THIS ARTICLE
MOMENTUM
Gilead Sciences: Upward Momentum Slowing
03/14/13 03:27:45 PMby Donald W. Pendergast, Jr.
Shares of Gilead Sciences, Inc. have been in a long-term bull market for several years, but warnings of a bearish trend reversal are now in place.
Position: N/A
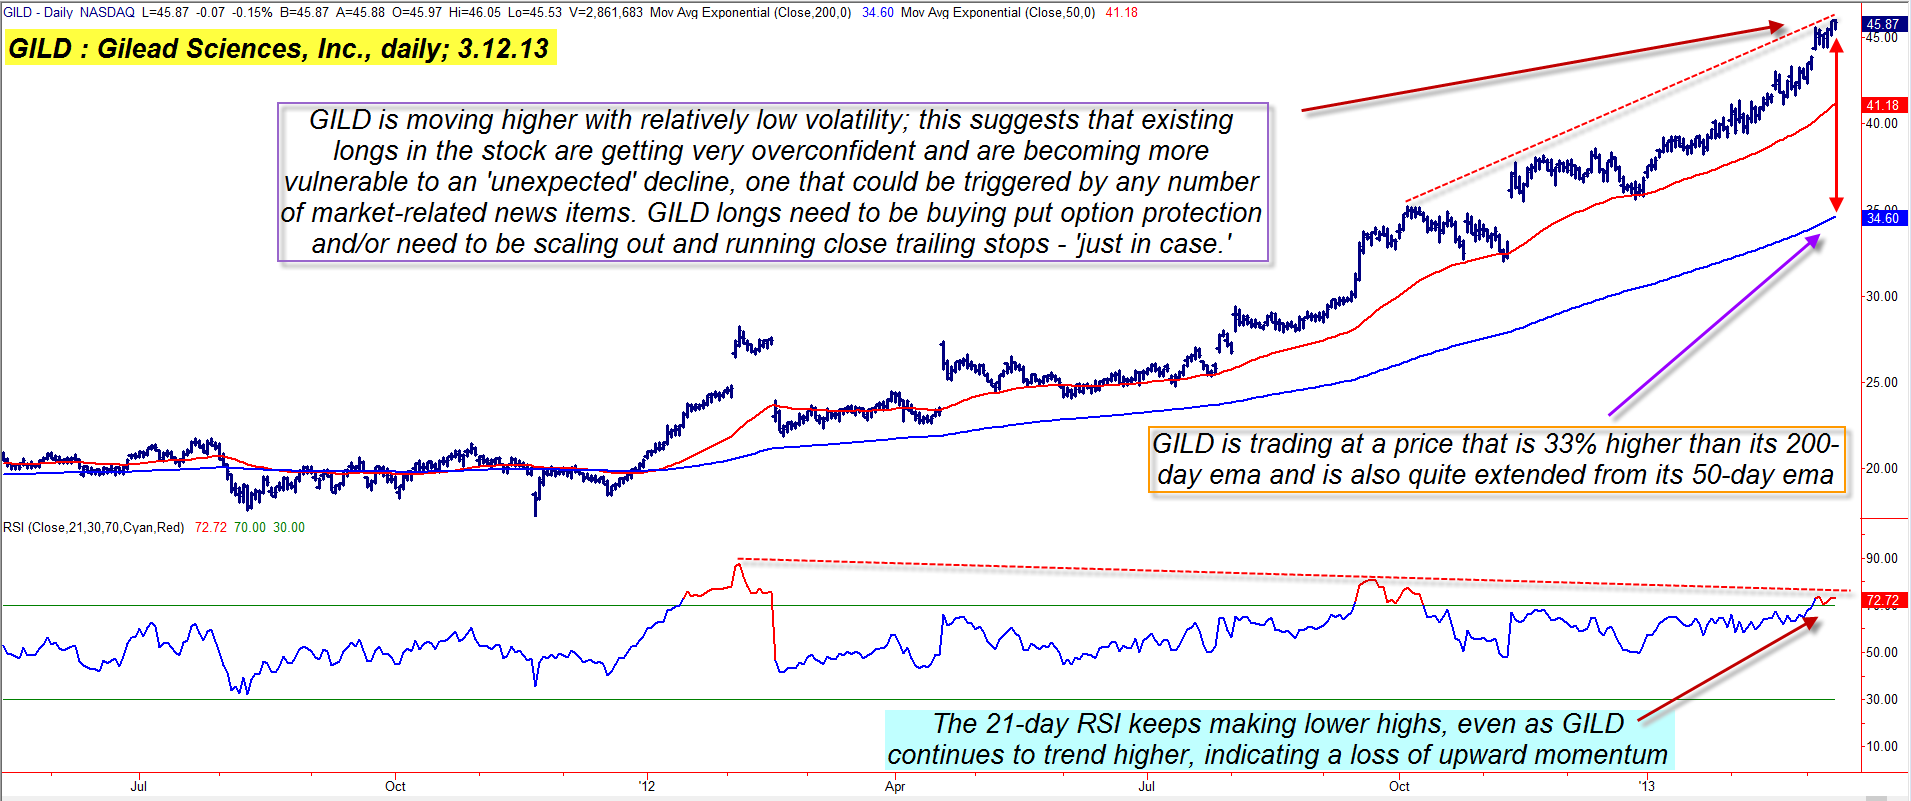
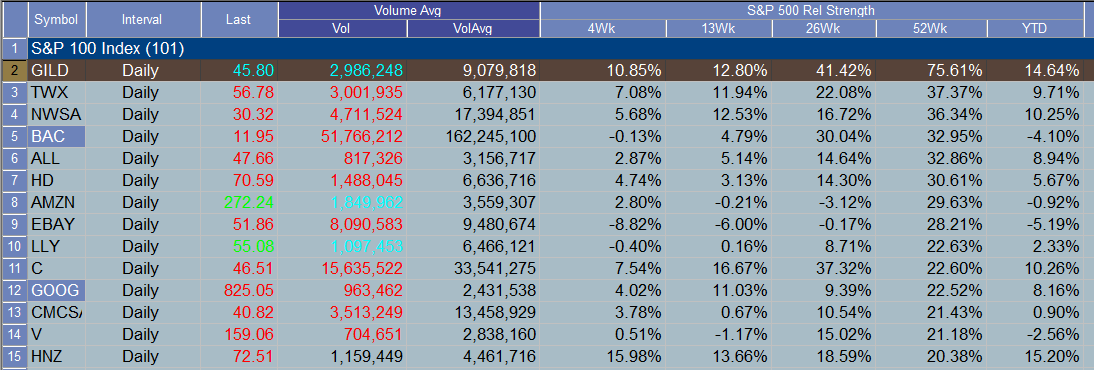
| Gilead Sciences, Inc. (GILD) has the best 26- and 52-week relative strength performance rank of any .OEX (S&P 100 index) stock, up by 41.42% and 75.61%, respectively. The stock is also outperforming the .SPX/.OEX over the past four- and 13-week periods and is up by more than 14% YTD. On top of that, the stock is trading at multi-year highs, grinding higher with relatively low volatility - a true 'dream stock' for covered call traders and long-term bulls. Nevertheless, insightful analysis of GILD's daily chart reveals that the stock may soon be on the verge of a significant correction or major trend reversal. Here's a closer look now. |
|
| Figure 1: GILD's long-running uptrend is fast approaching a price zone where it becomes extremely vulnerable to a sharp 'unexpected' sell-off. |
| Graphic provided by: TradeStation. |
| |
| It's never a good idea to proclaim to the world that a certain stock is going to peak at a certain price or turn lower on a specific day, but it is always a wise trading or investing practice to be aware of the technical standing of a stock that has already made an impressive bullish rally and is at multi-year or even all time highs. In the case of GILD, there are four technical indicators that are screaming 'caution', warning latecomers against buying at such a late stage even as they advise existing longs to aggressively protect their open positions in the stock: 1. Long term money flow (CMF)(100) is dropping off at a rapid rate, confirming steady distribution of shares from the 'smart money' to less experienced traders or investors. 2. Medium-term money flow (CMF)(34) is also confirming the same distribution dynamic. 3. The 21-day RSI keeps making progressively lower peaks even as GILD has moved upwards; upward momentum is slowing steadily. 4. GILD is trading far above its blue 200-day exponential moving average (EMA) - 33% higher - and is becoming more vulnerable to a sharp correction; the stock is also trading well above its 50-day EMA (red line) and is yet another warning sign that GILD is due for a pullback of some degree in the days and weeks ahead. GILD is also in a modest parabolic rise, something else that would seem to be advising extreme caution for existing longs. Fundamentally (earnings growth, P/E, etc), GILD appears to be in good shape, but the stock seems to be priced to 'perfection' as some might say, making it vulnerable to any bad news that might be released, no matter how minor or insignificant. With the major stock indexes all close to or at all time highs again, this is a time for discretion and risk control like none other; GILD longs might want to consider buying at-the-money (ATM) puts with four to five months time value; a sudden correction in the stock should drive implied volatilities higher, inflating the put values even as their deltas increase, helping to offset the open losses in the stock itself. Speculative bears might want to focus on buying the August '13 GILD $45.00 puts if the stock breaks below 44.51; the 50-day EMA (currently near 41.25) would be the logical profit target for such a trade, although smaller targets could also be established for a portion of the position. Trade management is simple for such a trade; if the options double in price, buy them back (most if not all your position) and smile; aggressive bears might hold out for more gains, but a 100% gain is more than enough for most traders. If they lose 50% of their value, sell them for a loss and wait for other high probability trade setups to appear. Given that this is a trend reversal type setup (if 44.51 is breached), keeping your account risk small is important; most traders should always keep such per-trade risks at 1 to 2% of their account value, no matter how bullish or bearish they may feel about a stock. Trade wisely until we meet here again. |
|
| Figure 2: GILD is outperforming the rest of its S&P 100 (.OEX) peers by a wide margin, especially over the most recent 26- and 52-week periods. |
| Graphic provided by: TradeStation. |
| Graphic provided by: TradeStation Radar Screen. |
| |
Freelance financial markets writer and online publisher of the Trendzetterz.com S&P 500 Weekly Forecast service.
| Title: | Market consultant and writer |
| Company: | Trendzetterz |
| Address: | 81 Hickory Hollow Drive |
| Crossville, TN 38555 | |
| Phone # for sales: | 904-303-4814 |
| Website: | trendzetterz.com |
| E-mail address: | support@trendzetterz.com |
Traders' Resource Links | |
| Trendzetterz has not added any product or service information to TRADERS' RESOURCE. | |
Click here for more information about our publications!
PRINT THIS ARTICLE

Request Information From Our Sponsors
- StockCharts.com, Inc.
- Candle Patterns
- Candlestick Charting Explained
- Intermarket Technical Analysis
- John Murphy on Chart Analysis
- John Murphy's Chart Pattern Recognition
- John Murphy's Market Message
- MurphyExplainsMarketAnalysis-Intermarket Analysis
- MurphyExplainsMarketAnalysis-Visual Analysis
- StockCharts.com
- Technical Analysis of the Financial Markets
- The Visual Investor
- VectorVest, Inc.
- Executive Premier Workshop
- One-Day Options Course
- OptionsPro
- Retirement Income Workshop
- Sure-Fire Trading Systems (VectorVest, Inc.)
- Trading as a Business Workshop
- VectorVest 7 EOD
- VectorVest 7 RealTime/IntraDay
- VectorVest AutoTester
- VectorVest Educational Services
- VectorVest OnLine
- VectorVest Options Analyzer
- VectorVest ProGraphics v6.0
- VectorVest ProTrader 7
- VectorVest RealTime Derby Tool
- VectorVest Simulator
- VectorVest Variator
- VectorVest Watchdog