

HOT TOPICS LIST
- MACD
- Fibonacci
- RSI
- Gann
- ADXR
- Stochastics
- Volume
- Triangles
- Futures
- Cycles
- Volatility
- ZIGZAG
- MESA
- Retracement
- Aroon
INDICATORS LIST
LIST OF TOPICS
PRINT THIS ARTICLE
by Chaitali Mohile
Goldman Sachs Group is extremely bullish.
Position: Hold
Chaitali Mohile
Active trader in the Indian stock markets since 2003 and a full-time writer. Trading is largely based upon technical analysis.
PRINT THIS ARTICLE
CHART ANALYSIS
The Short-Term Rally Of GS
03/12/13 02:31:37 PMby Chaitali Mohile
Goldman Sachs Group is extremely bullish.
Position: Hold
| Goldman Sachs Group (GS) has been a buyer's stock for the last year and half. The stock has steadily surged, offering handsome monetary gains to traders and investors. GS went from 90 to 160 in a time span of nine months. Eventually, the rally turned extremely bullish and showed signs of a reversal. The indicators used in Figure 1 became extremely overbought, causing a trend reversal rally. The vertical price rally on the daily time frame narrowed as it hit a new high at 156. The average directional index (ADX) (14) that followed the rally overheated. This suggested that the share price was likely to plunge a few points. |
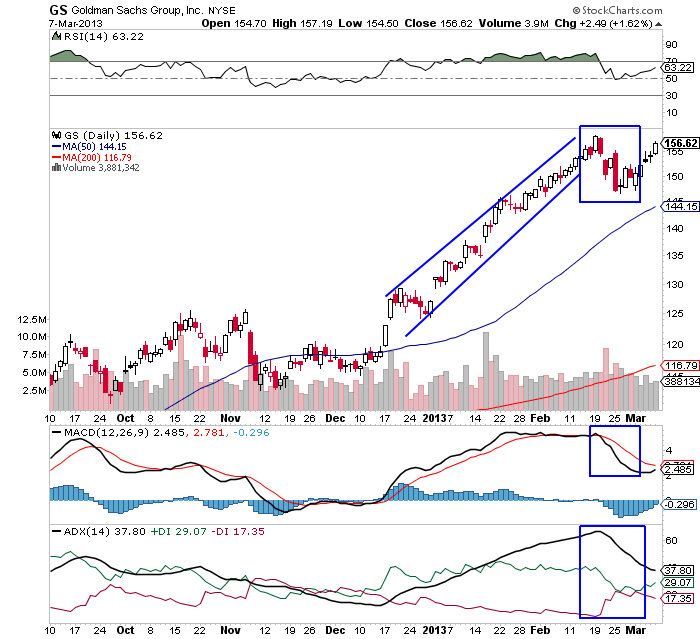
|
| Figure 1: Daily chart for Goldman Sachs Group, Inc. (GS). |
| Graphic provided by: StockCharts.com. |
| |
| An overbought relative strength index (RSI) (14) was unable to sustain above 70, and the value of moving average convergence/divergence (MACD) (12,26,9) at 5 was likely to turn negative in positive territory. The gap between the MACD line and trigger line disappeared before the indicator underwent a bearish crossover above the zero line. These extremely bullish indicators resulted in an intermediate technical bearish rally in GS. It plunged seven points, dragging all the indicators to comfortable bullish zones. Since GS is a strong stock, price and indicators sustained bullish levels. The 50-day moving average (MA) support remained untouched. The stock recovered immediately, showing its bullish strength. |
|
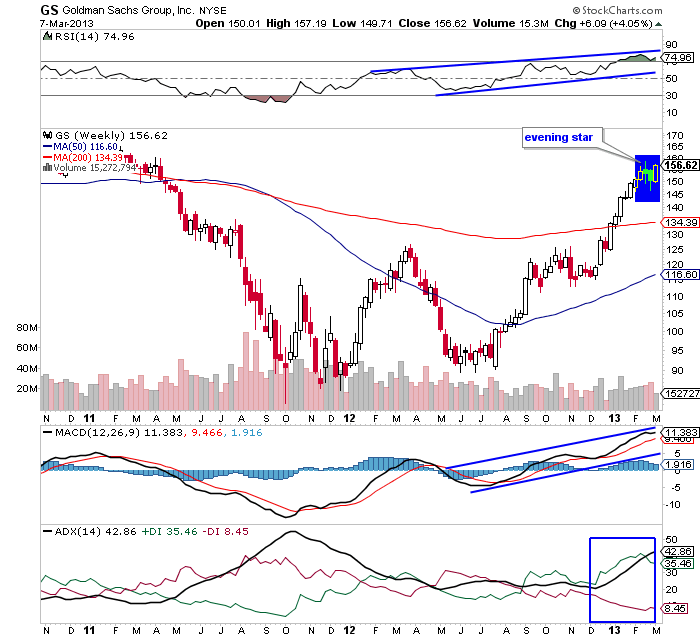
| Figure 2: Weekly chart for Goldman Sachs Group, Inc. (GS). |
| Graphic provided by: StockCharts.com. |
| |
| An evening star candlestick pattern formed on the weekly chart of GS in Figure 2. The evening star is a bearish reversal pattern that initiates a downside rally. Price has established strong support at the new high. The RSI (14) has not changed its direction, the uptrend in ADX (14) had reached an overheated zone, and the MACD (12,26,9) is positive. This suggests that the previous advance rally is likely to move sideways. |
| The bullish indicators have reversed the rally in GS to a sideways consolidation. This generated buying opportunities for long-term traders and investors. GS is one of the strongest stocks in favor of buyers. Traders who hold long poisitions in the stock should hold on to them. |
Active trader in the Indian stock markets since 2003 and a full-time writer. Trading is largely based upon technical analysis.
| Company: | Independent |
| Address: | C1/3 Parth Indraprasth Towers. Vastrapur |
| Ahmedabad, Guj 380015 | |
| E-mail address: | chaitalimohile@yahoo.co.in |
Traders' Resource Links | |
| Independent has not added any product or service information to TRADERS' RESOURCE. | |
Click here for more information about our publications!
PRINT THIS ARTICLE

Request Information From Our Sponsors
- VectorVest, Inc.
- Executive Premier Workshop
- One-Day Options Course
- OptionsPro
- Retirement Income Workshop
- Sure-Fire Trading Systems (VectorVest, Inc.)
- Trading as a Business Workshop
- VectorVest 7 EOD
- VectorVest 7 RealTime/IntraDay
- VectorVest AutoTester
- VectorVest Educational Services
- VectorVest OnLine
- VectorVest Options Analyzer
- VectorVest ProGraphics v6.0
- VectorVest ProTrader 7
- VectorVest RealTime Derby Tool
- VectorVest Simulator
- VectorVest Variator
- VectorVest Watchdog
- StockCharts.com, Inc.
- Candle Patterns
- Candlestick Charting Explained
- Intermarket Technical Analysis
- John Murphy on Chart Analysis
- John Murphy's Chart Pattern Recognition
- John Murphy's Market Message
- MurphyExplainsMarketAnalysis-Intermarket Analysis
- MurphyExplainsMarketAnalysis-Visual Analysis
- StockCharts.com
- Technical Analysis of the Financial Markets
- The Visual Investor