HOT TOPICS LIST
- MACD
- Fibonacci
- RSI
- Gann
- ADXR
- Stochastics
- Volume
- Triangles
- Futures
- Cycles
- Volatility
- ZIGZAG
- MESA
- Retracement
- Aroon
INDICATORS LIST
LIST OF TOPICS
PRINT THIS ARTICLE
by Donald W. Pendergast, Jr.
Up by nearly 450% in 17 months - prior to today's plunge -shares of Celldex Therapeutics had given prior warning that its latest parabolic rise was unsustainable.
Position: N/A
Donald W. Pendergast, Jr.
Freelance financial markets writer and online publisher of the Trendzetterz.com S&P 500 Weekly Forecast service.
PRINT THIS ARTICLE
KELTNER CHANNELS
CLDX: Plenty Of Warning Before The Plunge
03/08/13 09:36:52 AMby Donald W. Pendergast, Jr.
Up by nearly 450% in 17 months - prior to today's plunge -shares of Celldex Therapeutics had given prior warning that its latest parabolic rise was unsustainable.
Position: N/A
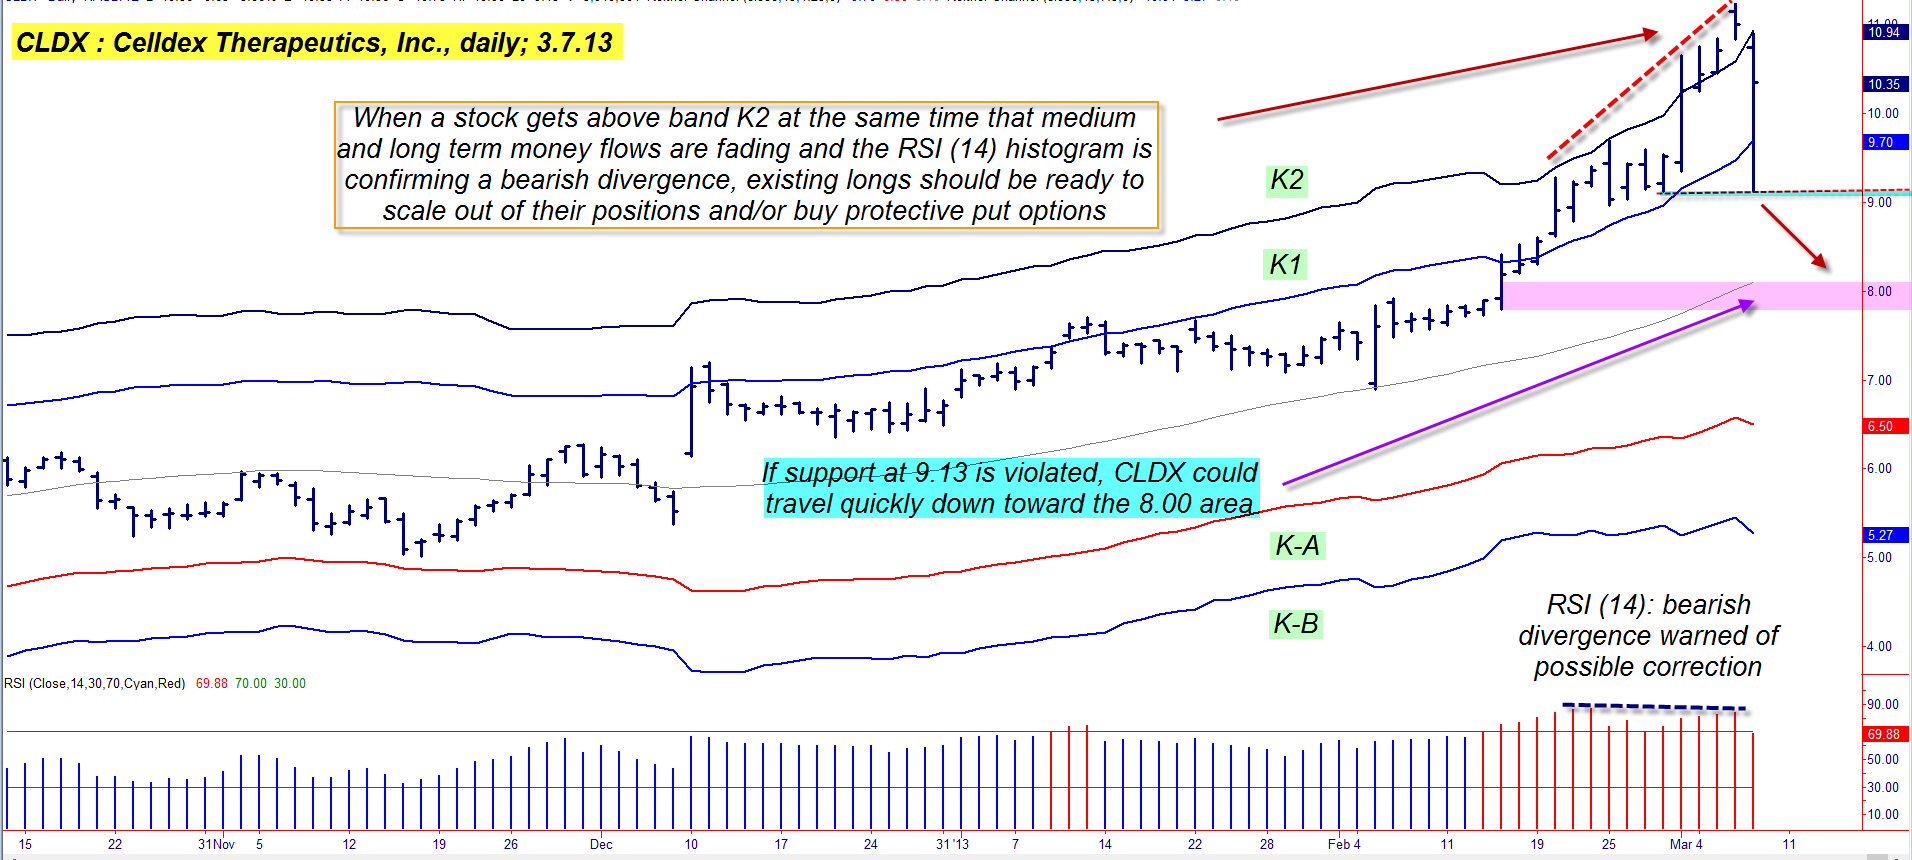
| Traders and investors who remember the big gains made in biotech stocks circa 1990/1991 aren't at all surprised at the ability of at least some of the stocks in this volatile group to go on massive uptrends (and downtrends) from time to time. In the case of Celldex Therapeutics (CLDX), the stock has rocketed higher by 448% between October 4, 2011 and March 6, 2013. But when the company released its Q4 2012 earnings - a net loss of 16.8 million dollars or .27 per share - before the market open on March 7, 2013, frightened bulls and greedy bears wasted little time in selling the stock; in less than 4 minutes CLDX went from 10.75 to 9.13 before the buyers stepped back in to offer support. The previous five days of gains were wiped out in about 3.5 minutes of frantic, run for the exits trading action. It would have been a stressful and chaotic moment if you were holding long positions from the night before. However, CLDX had already given plenty of warning that a sharp correction was probable, and the earnings release was the precipitating event that unleashed the correction with extra fury and speed. Here's a basic but timely technical education lesson that wise traders and long-term investors can learn to put to good use in the months and years to come; let's look at CLDX's daily chart. |

|
| Figure 1: The wise, combined use of Keltner bands, money flow and price/momentum analysis can help alert traders and investors in advance of high-probability corrections and reversals. |
| Graphic provided by: TradeStation. |
| |
| Plotted on the chart in Figure 1 is a basic Keltner band overlay, one that works pretty well on all liquid stocks and commodity charts; most of the time, CLDX tends to stay within the boundaries defined by bands K1 and K-A and that's where a variety of short- to medium-term swing and trend moves take place. However, once the higher-degree price cycles begin dominating the price action (pushing it higher or lower), that's when you typically see the breaks above K1 or K2 on the upside and below K-A and K-B on the downside. Most recently, it has been CLDX's longer term bullish cycles that thrust it over the top of band K2, and that's when savvy technicians and chart watchers would have been preparing for a high-probability, near-term correction in the price of this stock. These same market-wise chartists would also have been monitoring CLDX for signs of bearish price/momentum divergence, and one look at the 14-day RSI histogram (bottom of chart) would have confirmed that the stock was gradually losing upward momentum even as it traded above band K2, which is a very bearish technical indicator combination. |

|
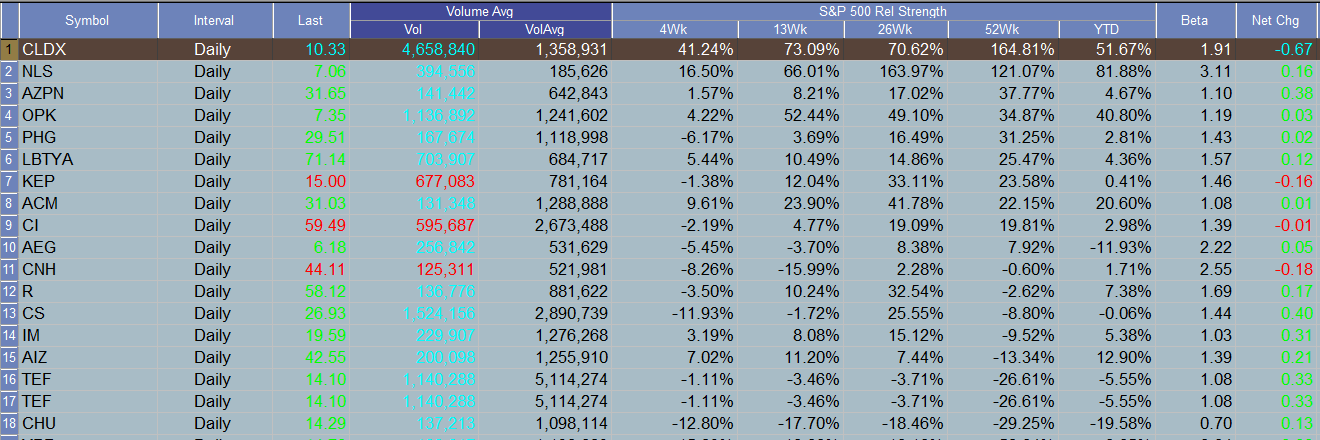
| Figure 2: Not even CLDX's ultra-bullish relative strength performance numbers could prevent the stock from being sold off sharply after news of its Q4 2012 net loss of (.27) per share was released. |
| Graphic provided by: TradeStation. |
| Graphic provided by: TradeStation Radar Screen. |
| |
| Decreasing upward momentum after a parabolic rise weren't the only pre-crash problems for CLDX, either; both the 34- and 100-day Chaikin Money flow histograms (CMF) had clearly confirmed that CLDX was under distribution by the "smart money" interests in the market and that its most recent rally was made on lower trade volumes. So, here's what to look for when attempting to spot a stock that has risen "too far, too fast:" 1. Look for the stock to be trading above band K2 on its daily chart. 2. Check to see if the 14-day RSI histogram is confirming a bearish divergence with price. 3. Check to see if the medium- and long-term CMF flow histograms are making progressively lower highs even as the stock made new highs. If this is a 'go' then you've spotted a stock that the "smart money" big guns in the market are actively selling out of. CLDX's daily chart confirmed all of the above prior to Thursday's intraday crash, and as such, existing longs would have known to buy protective puts and/or scale out of their hard won open gains before the Q4 2012 earnings were to be released. No one could have known how violently CLDX would correct, but at least for educated traders/investors, the stock's daily chart was gracious enough to provide those with wisdom the understanding of the stock's precariously high (and unsustainable) current price levels. Now that you know what warning signs to look for after a stock has gone on a parabolic bullish run, you can also learn to protect your open gains and even avoid unnecessary losses. Trade wisely until we meet here again. |
Freelance financial markets writer and online publisher of the Trendzetterz.com S&P 500 Weekly Forecast service.
| Title: | Market consultant and writer |
| Company: | Trendzetterz |
| Address: | 81 Hickory Hollow Drive |
| Crossville, TN 38555 | |
| Phone # for sales: | 904-303-4814 |
| Website: | trendzetterz.com |
| E-mail address: | support@trendzetterz.com |
Traders' Resource Links | |
| Trendzetterz has not added any product or service information to TRADERS' RESOURCE. | |
Click here for more information about our publications!
PRINT THIS ARTICLE

Request Information From Our Sponsors
- StockCharts.com, Inc.
- Candle Patterns
- Candlestick Charting Explained
- Intermarket Technical Analysis
- John Murphy on Chart Analysis
- John Murphy's Chart Pattern Recognition
- John Murphy's Market Message
- MurphyExplainsMarketAnalysis-Intermarket Analysis
- MurphyExplainsMarketAnalysis-Visual Analysis
- StockCharts.com
- Technical Analysis of the Financial Markets
- The Visual Investor
- VectorVest, Inc.
- Executive Premier Workshop
- One-Day Options Course
- OptionsPro
- Retirement Income Workshop
- Sure-Fire Trading Systems (VectorVest, Inc.)
- Trading as a Business Workshop
- VectorVest 7 EOD
- VectorVest 7 RealTime/IntraDay
- VectorVest AutoTester
- VectorVest Educational Services
- VectorVest OnLine
- VectorVest Options Analyzer
- VectorVest ProGraphics v6.0
- VectorVest ProTrader 7
- VectorVest RealTime Derby Tool
- VectorVest Simulator
- VectorVest Variator
- VectorVest Watchdog
