

HOT TOPICS LIST
- MACD
- Fibonacci
- RSI
- Gann
- ADXR
- Stochastics
- Volume
- Triangles
- Futures
- Cycles
- Volatility
- ZIGZAG
- MESA
- Retracement
- Aroon
INDICATORS LIST
LIST OF TOPICS
PRINT THIS ARTICLE
by Donald W. Pendergast, Jr.
They've been sold off mercilessly for the past few months, but a tradable bottom reversal may soon be at hand for the stocks in the precious metals mining industry group.
Position: N/A
Donald W. Pendergast, Jr.
Freelance financial markets writer and online publisher of the Trendzetterz.com S&P 500 Weekly Forecast service.
PRINT THIS ARTICLE
REVERSAL
Gold And Silver Miners Prepare To Reverse Higher
03/07/13 04:23:16 PMby Donald W. Pendergast, Jr.
They've been sold off mercilessly for the past few months, but a tradable bottom reversal may soon be at hand for the stocks in the precious metals mining industry group.
Position: N/A
| It's not everyday that a beaten-down stock industry group begins to flash signs that a final, enduring low has and/or will be achieved, but that's what looks to be the case when scanning across the universe of freely-traded precious metals (PM) mining stock charts. In this article I will look at the Market Vectors Gold Miners ETF (GDX) on its daily chart to see how likely it is that the entire PM stock group will soon experience a tradable bullish reversal. |
|
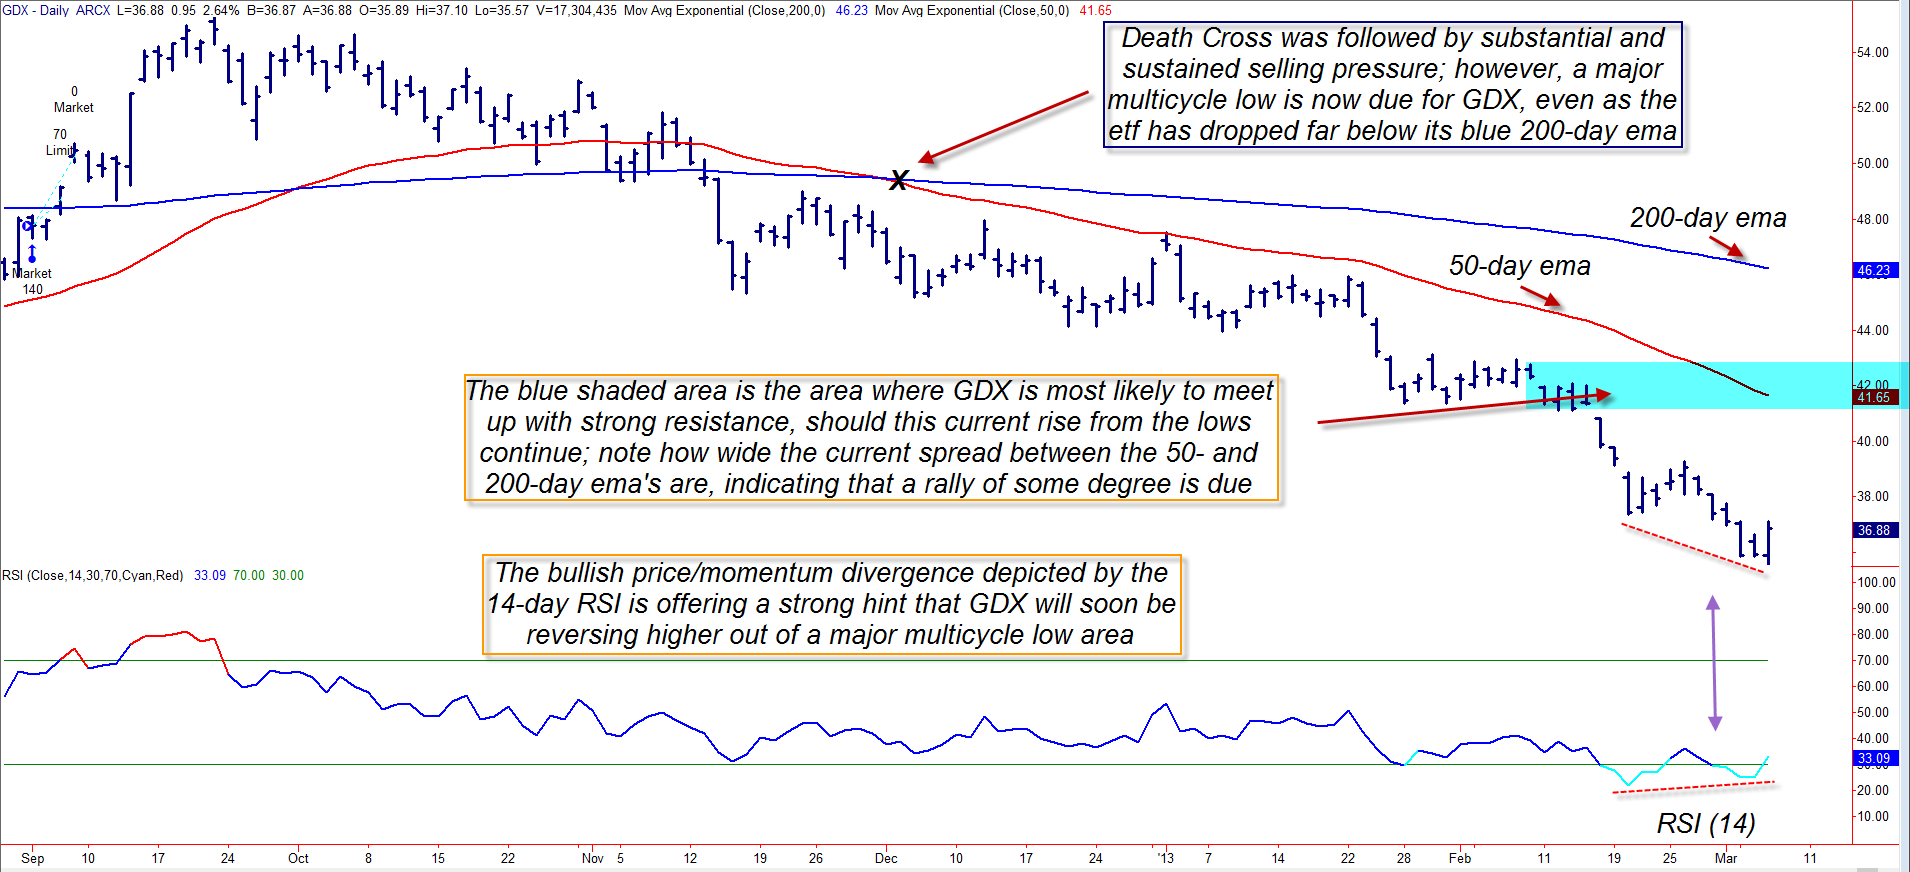
| FIGURE 1: Bearish follow through after a death cross of the 50-day EMA below the 200-day EMA isn't surprising at all. However, for the next few weeks or months GDX should begin to recoup some of its losses. |
| Graphic provided by: TradeStation. |
| |
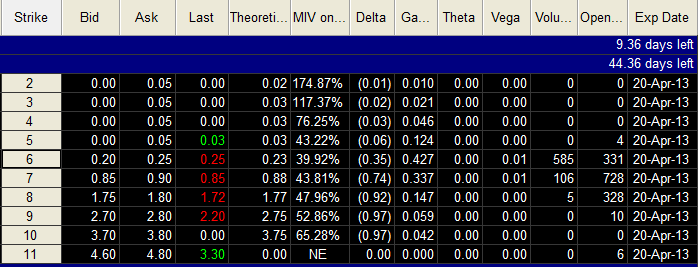
| GDX managed to shed more than 35% of its value between September 21, 2012 and the start of trading on March 6, 2013, and gold stock bears are no doubt delighted with this unfortunate turn of events in the component stocks that make up this high-volume ETF. But the bears may soon have the smirks wiped off their overly confident faces if GDX and its components are now in the process of bottoming prior to a violent relief rally - one caused by last-minute short covering and the continued accumulation of PM stock shares by the so-called smart money. Let's look at some of the clues that GDX is now telegraphing to astute, opportunity-seeking traders: 1. Prior to today's open, GDX was trading at a price that was 14% less than the value of its 200-day exponential moving average (EMA). This wide of a spread between the 200-day EMA and price is generally unsustainable - hinting at an upcoming rally. 2. The spread between the red 50-day EMA and the blue 200-day EMA is also unusually wide; this also suggests near-term exhaustion of selling pressures. 3. GDX is also due to have a multicycle low sometime between now and late March 2013. 4. The 14-day RSI is now revealing a very bullish price/momentum divergence. 5. The earnings growth potential (in relation to the new discounted price) of a majority of mid-cap and large-cap PM stocks is now much more favorable, making the purchase of PM stocks a better deal for value investors. Taken together as a whole, GDX's daily chart is painting a bullish picture for both short-term traders and longer term investors. One of GDX's component stocks -IAMGold (IAG) looks particularly interesting here, as it has been among the hardest hit of all major PM stocks. IAG is off by 64% since late September of last year and is also manifesting the same kind of bullish reversal hints as GDX; the sale of the April 2013 IAG $6.00 put looks to be an excellent, modest-risk option credit play, one that will do very well if IAG also joins in on this anticipated reversal across the PM stock group. The put has an open interest figure of 331 contracts, which is respectable; the bid/ask spread is a full .05, though, and that means you may want to wait for IAG to do the following before selling this put: 1. Wait for Wednesday's high of 6.37 to be exceeded. 2. Then wait for an intraday pullback, looking to get filled at a price of .25 or better per contract. If filled, hold the put or puts until they rise by 85-90% or decline in value by 50-60%; in either situation, buy them back and get out of the trade. Risk no more than 1% of your account equity on this or any other stock/option play and you'll be taking the most important step of all toward ensuring profitable trading, which is that of controlling your account risk. Trade wisely until we meet here again. |
|
| FIGURE 2: The April 2013 IAG $6.00 puts have an open interest figure of 331 contracts. Also note the heavy open interest at the $7.00 and $8.00 strike prices. |
| Graphic provided by: TradeStation. |
| Graphic provided by: TradeStation Options Analysis. |
| |
Freelance financial markets writer and online publisher of the Trendzetterz.com S&P 500 Weekly Forecast service.
| Title: | Market consultant and writer |
| Company: | Trendzetterz |
| Address: | 81 Hickory Hollow Drive |
| Crossville, TN 38555 | |
| Phone # for sales: | 904-303-4814 |
| Website: | trendzetterz.com |
| E-mail address: | support@trendzetterz.com |
Traders' Resource Links | |
| Trendzetterz has not added any product or service information to TRADERS' RESOURCE. | |
Click here for more information about our publications!
PRINT THIS ARTICLE

Request Information From Our Sponsors
- StockCharts.com, Inc.
- Candle Patterns
- Candlestick Charting Explained
- Intermarket Technical Analysis
- John Murphy on Chart Analysis
- John Murphy's Chart Pattern Recognition
- John Murphy's Market Message
- MurphyExplainsMarketAnalysis-Intermarket Analysis
- MurphyExplainsMarketAnalysis-Visual Analysis
- StockCharts.com
- Technical Analysis of the Financial Markets
- The Visual Investor
- VectorVest, Inc.
- Executive Premier Workshop
- One-Day Options Course
- OptionsPro
- Retirement Income Workshop
- Sure-Fire Trading Systems (VectorVest, Inc.)
- Trading as a Business Workshop
- VectorVest 7 EOD
- VectorVest 7 RealTime/IntraDay
- VectorVest AutoTester
- VectorVest Educational Services
- VectorVest OnLine
- VectorVest Options Analyzer
- VectorVest ProGraphics v6.0
- VectorVest ProTrader 7
- VectorVest RealTime Derby Tool
- VectorVest Simulator
- VectorVest Variator
- VectorVest Watchdog