

HOT TOPICS LIST
- MACD
- Fibonacci
- RSI
- Gann
- ADXR
- Stochastics
- Volume
- Triangles
- Futures
- Cycles
- Volatility
- ZIGZAG
- MESA
- Retracement
- Aroon
INDICATORS LIST
LIST OF TOPICS
PRINT THIS ARTICLE
by Matt Blackman
On March 5, 2013, the DJIA registered a new all-time high. But before we celebrate, let's determine if it's sustainable and what the trading opportunities are if it is not sustainable.
Position: N/A
Matt Blackman
Matt Blackman is a full-time technical and financial writer and trader. He produces corporate and financial newsletters, and assists clients in getting published in the mainstream media. He is the host of TradeSystemGuru.com. Matt has earned the Chartered Market Technician (CMT) designation. Find out what stocks and futures Matt is watching on Twitter at www.twitter.com/RatioTrade
PRINT THIS ARTICLE
SHORT SELLING
A 2B Top Or Continuation?
03/06/13 03:34:40 PMby Matt Blackman
On March 5, 2013, the DJIA registered a new all-time high. But before we celebrate, let's determine if it's sustainable and what the trading opportunities are if it is not sustainable.
Position: N/A
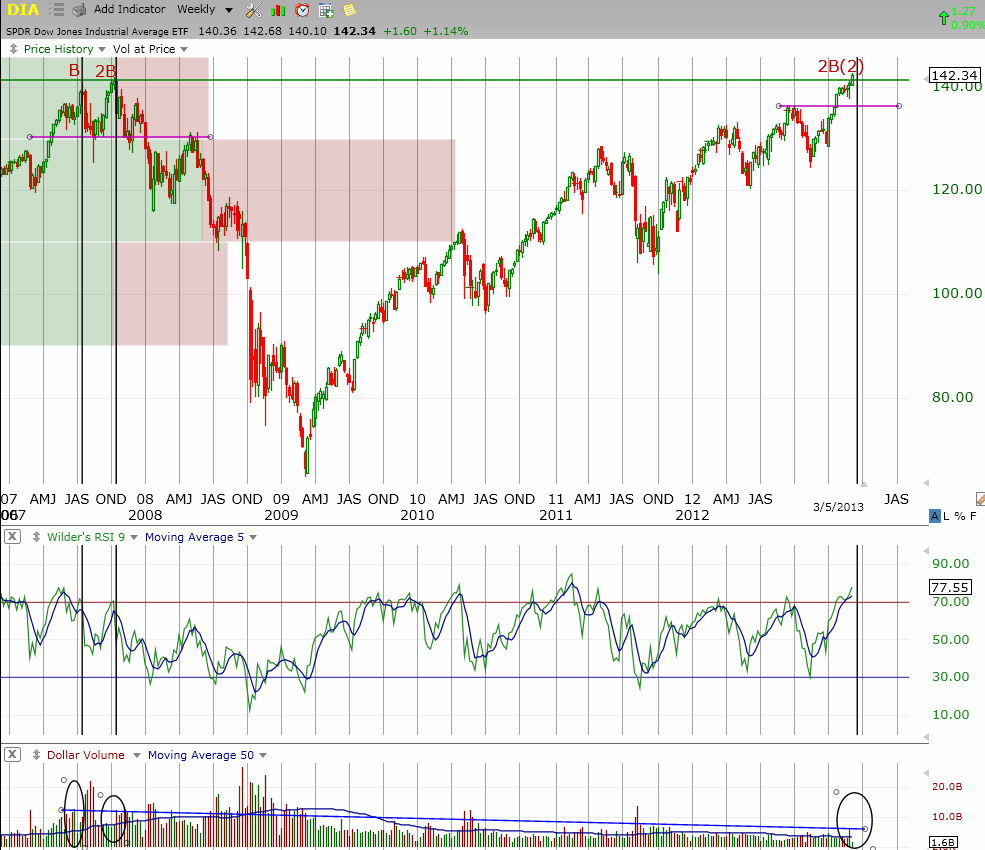
| In his book, "Principles of Professional Speculation," Trader Vic Sperandeo discusses the 2B Top pattern. In the process he outlines how to identify a potential double-top pattern before the neckline is breached. His rules for the 2B short trade are as follows. First, after putting in a new high (B), the stock must experience a decent retracement. Next, it must again challenge the B high to post a new high (2B). This high must experience no follow-through and be followed by a close below the breakout low of the bar in which the new high was made. Once these criteria had been met, he advises traders to sell the stock short on a break below the breakout bar low with a price target of the major swing low (see purple line on right hand side of Figure 1). |
|
| Figure 1 � Weekly chart showing the SPDR Dow Jones Industrial Average ETF (DIA) putting in a new high March 5, 2013 compared to the previous new high in 2007. Note the declining volume with each attempt which is bearish. Also note the strong negative RSI divergence between points B and 2B in 2007. |
| Graphic provided by: TC2000.com. |
| |
| As you see in Figure 1, DIA failed on its 2B attempt the week of October 5 in that the new October 5 high occurred on lower volume than the July high. Volume on the October 12 weekly high was also lower than the October 5 weekly high: a clear sign that bullish commitment to the trend was waning. Fast forward to March 5, 2013 and notice that volume has so far remained well below that of both 2007 peaks. Anemic volume for the week of March 8 would be a bearish omen. |
|
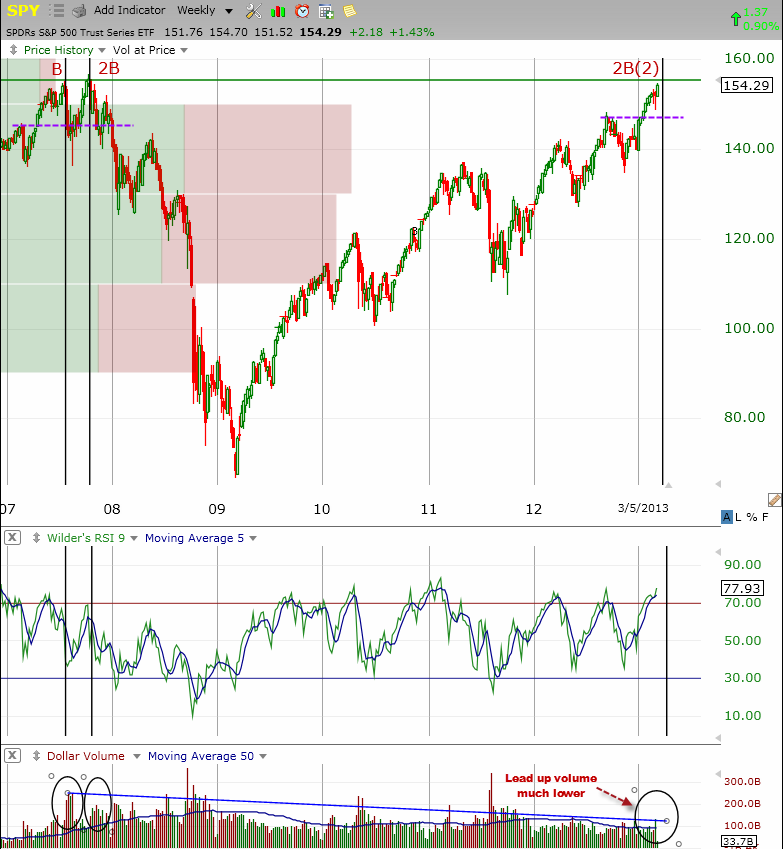
| Figure 2 � Same time period as Figure 1 for the Standard & Poors 500 Trust ETF (SPY) which shows the performance of a wider range of stocks which has yet to reach the 2007 high. |
| Graphic provided by: TC2000.com. |
| |
| Another issue to watch will be the SPY since it represents a greater number of stocks. As of this writing, it had yet to reach the 2007 high but had managed to mount the new attempt on lower volume indicating another lack of commitment on the part of buyers. |
| As Tom Bulkowski points out on his website, www.thepatternsite.com in a discussion of the 2B top at http://goo.gl/CgwHj, 2B patterns have a high failure rate (65%) but he did not address volume in his study. He also stated that the 2B pattern is not meant to detect a trend change, only the shorter-term reversal which brings up an interesting point. |
| This article is not meant to call another top in the market but to point out that if the events outlined above occur and this breakout attempt fails, there will be money to be made by those who know how to read the signs. And if the 2B pattern does end up being a good short, the odds of a double-top pattern being confirmed with a breach of the purple necklines on the right hand side of the two above charts get a lot better. |
Matt Blackman is a full-time technical and financial writer and trader. He produces corporate and financial newsletters, and assists clients in getting published in the mainstream media. He is the host of TradeSystemGuru.com. Matt has earned the Chartered Market Technician (CMT) designation. Find out what stocks and futures Matt is watching on Twitter at www.twitter.com/RatioTrade
| Company: | TradeSystemGuru.com |
| Address: | Box 2589 |
| Garibaldi Highlands, BC Canada | |
| Phone # for sales: | 604-898-9069 |
| Fax: | 604-898-9069 |
| Website: | www.tradesystemguru.com |
| E-mail address: | indextradermb@gmail.com |
Traders' Resource Links | |
| TradeSystemGuru.com has not added any product or service information to TRADERS' RESOURCE. | |
Click here for more information about our publications!
Comments

Request Information From Our Sponsors
- StockCharts.com, Inc.
- Candle Patterns
- Candlestick Charting Explained
- Intermarket Technical Analysis
- John Murphy on Chart Analysis
- John Murphy's Chart Pattern Recognition
- John Murphy's Market Message
- MurphyExplainsMarketAnalysis-Intermarket Analysis
- MurphyExplainsMarketAnalysis-Visual Analysis
- StockCharts.com
- Technical Analysis of the Financial Markets
- The Visual Investor
- VectorVest, Inc.
- Executive Premier Workshop
- One-Day Options Course
- OptionsPro
- Retirement Income Workshop
- Sure-Fire Trading Systems (VectorVest, Inc.)
- Trading as a Business Workshop
- VectorVest 7 EOD
- VectorVest 7 RealTime/IntraDay
- VectorVest AutoTester
- VectorVest Educational Services
- VectorVest OnLine
- VectorVest Options Analyzer
- VectorVest ProGraphics v6.0
- VectorVest ProTrader 7
- VectorVest RealTime Derby Tool
- VectorVest Simulator
- VectorVest Variator
- VectorVest Watchdog