HOT TOPICS LIST
- MACD
- Fibonacci
- RSI
- Gann
- ADXR
- Stochastics
- Volume
- Triangles
- Futures
- Cycles
- Volatility
- ZIGZAG
- MESA
- Retracement
- Aroon
INDICATORS LIST
LIST OF TOPICS
PRINT THIS ARTICLE
by Koos van der Merwe
When a share is newly listed on the market and then drops 80% plus, do you look at it for a future buy?
Position: Accumulate
Koos van der Merwe
Has been a technical analyst since 1969, and has worked as a futures and options trader with First Financial Futures in Johannesburg, South Africa.
PRINT THIS ARTICLE
CUP WITH HANDLE
Looking At A Dog
03/05/13 02:08:07 PMby Koos van der Merwe
When a share is newly listed on the market and then drops 80% plus, do you look at it for a future buy?
Position: Accumulate
| Zynga (ZNGA) is a share that was listed on the market on December 16, 2011 with the rumor that Facebook (FB) would buy the company, because FB offered its games to be played on Zynga's website. The rumor however proved false. |

|
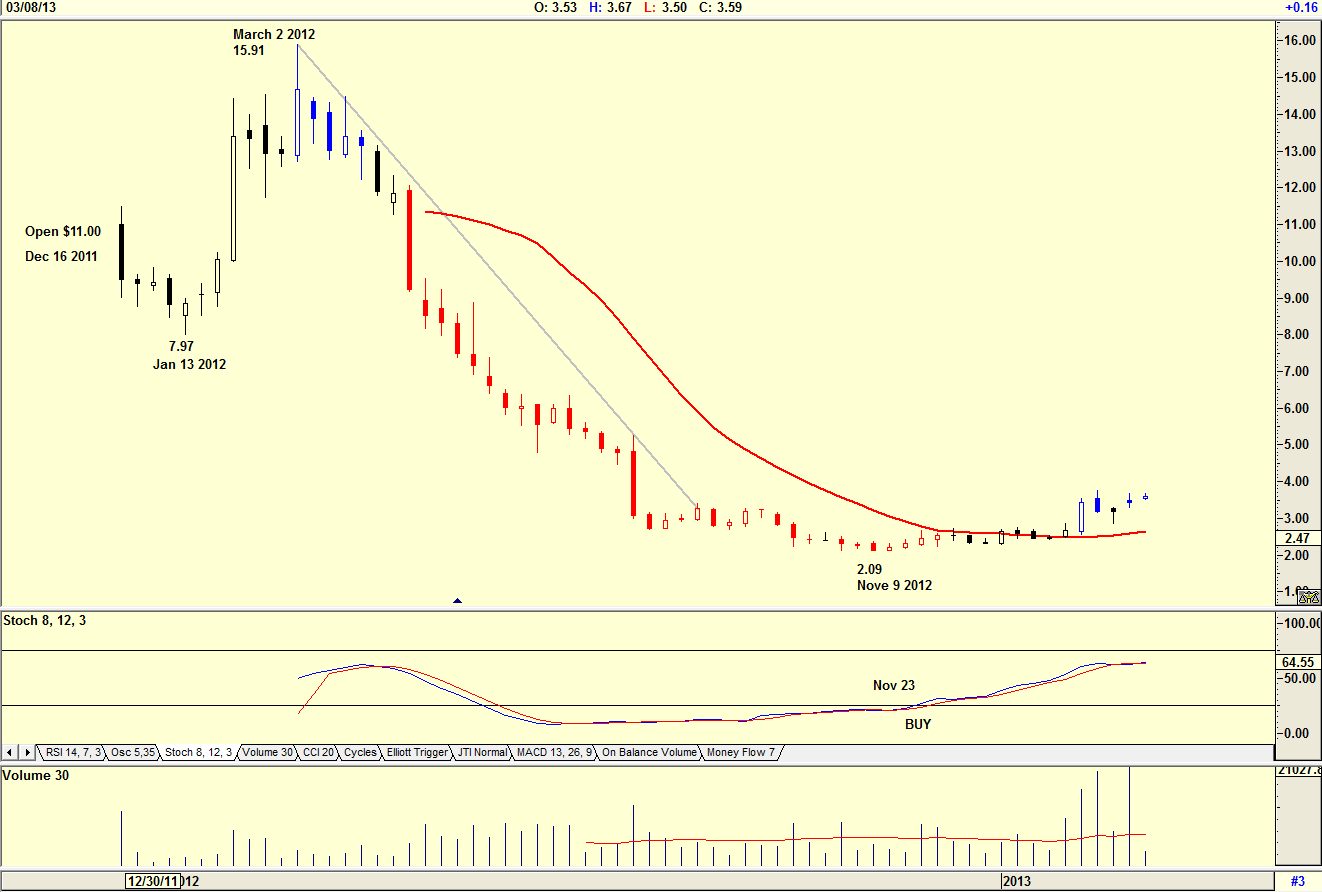
| Figure 1: Weekly chart of Zynga. |
| Graphic provided by: AdvancedGET. |
| |
| The weekly chart in Figure 1 of ZNGA shows how the share price initially fell from its listing price of $11.00 on December 16, 2011 to a low of $7.97 by January 13, 2012, probably as the 'newly created millionaires' sold shares to better their living standards. The share price then rose on the FB purchase rumor to $15.91 by March 2, 2012 and promptly fell to a low of $2.09 by November 9, 2012 as the rumor proved false. The company was one that grew too fast and was forced to bring its house in order. The share price started rising as speculators received a stochastic buy on November 23, 2012 on the hope that the share was oversold and could recover somewhat. Then came the rumor that the company would moving into gambling games. Is this the positive news speculators have been waiting for? |

|
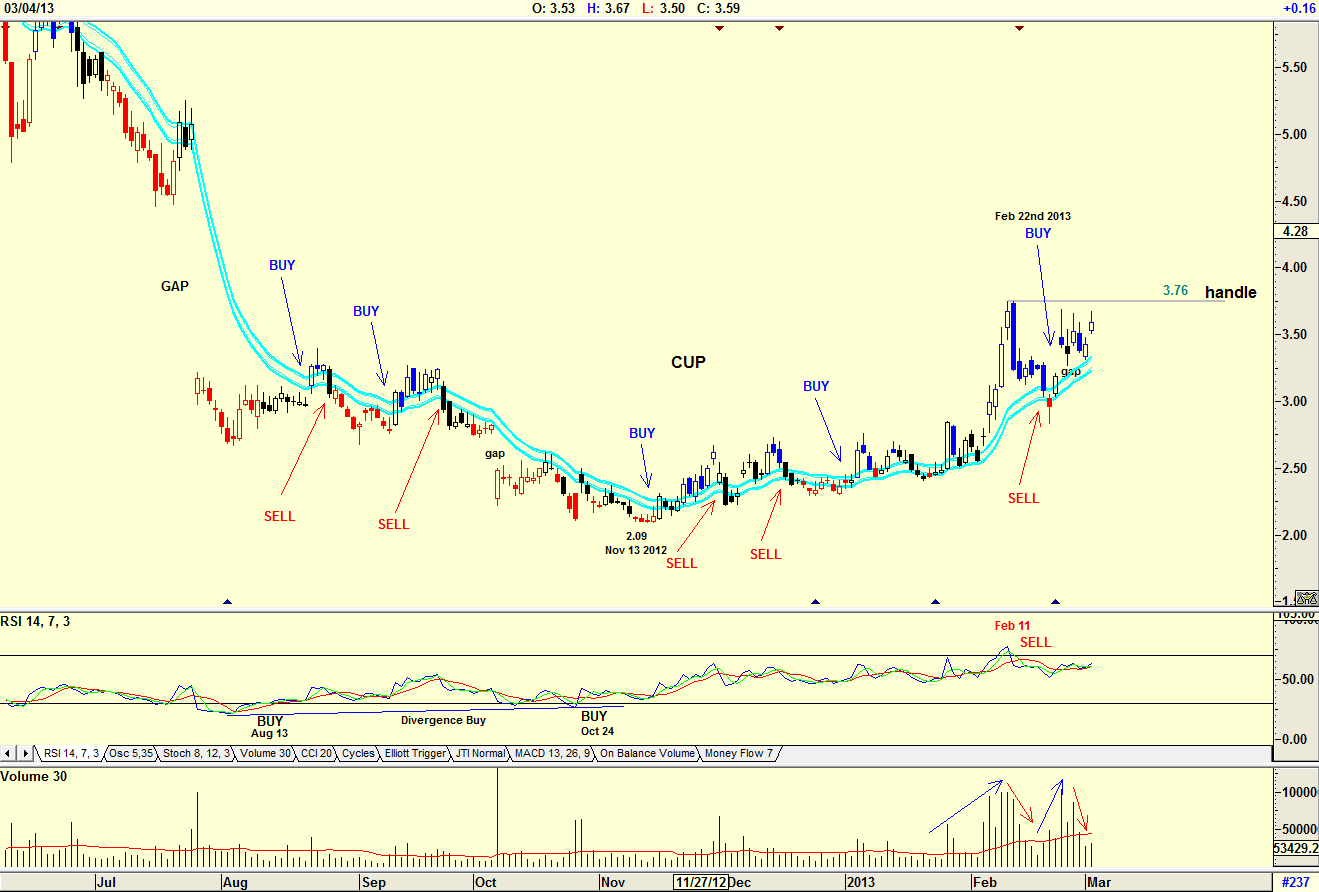
| Figure 2: Daily chart of Zynga |
| Graphic provided by: AdvancedGET. |
| |
| The daily chart in Figure 2 shows how the price fell strongly on a gap eventually bottoming at $2.09 on November 13, 2012. The chart shows that a cup-with-handle pattern has formed as price rose to fill the gap. With the handle at $3.76, a buy signal will be indicated should price move above this level. The JM internal band indicator did give a buy signal on February 22, 2013 on a gap. The JM internal band indicator is a 15-period simple moving average offset by 2% positive and 2% negative. Note that as the share price rose, volume rose: a positive sign. As the price fell, volume fell: another positive sign. However, the RSI gave a sell signal on February 11, 2013 which is reason for concern. If you had bought the stock at the first RSI buy signal on August 13, 2012, you would have been taken out with a stop signal soon after. You would have then bought the stock on the RSI buy of October 24, 2012 because it looks like a divergence buy signal, where the RSI signal rises as the stock price drops lower. This buy would have been successful. Investors, however, would have waited for the handle at $3.76 to break out of the cup-with-handle formation. |
Has been a technical analyst since 1969, and has worked as a futures and options trader with First Financial Futures in Johannesburg, South Africa.
| Address: | 3256 West 24th Ave |
| Vancouver, BC | |
| Phone # for sales: | 6042634214 |
| E-mail address: | petroosp@gmail.com |
Click here for more information about our publications!
PRINT THIS ARTICLE

|

Request Information From Our Sponsors
- StockCharts.com, Inc.
- Candle Patterns
- Candlestick Charting Explained
- Intermarket Technical Analysis
- John Murphy on Chart Analysis
- John Murphy's Chart Pattern Recognition
- John Murphy's Market Message
- MurphyExplainsMarketAnalysis-Intermarket Analysis
- MurphyExplainsMarketAnalysis-Visual Analysis
- StockCharts.com
- Technical Analysis of the Financial Markets
- The Visual Investor
- VectorVest, Inc.
- Executive Premier Workshop
- One-Day Options Course
- OptionsPro
- Retirement Income Workshop
- Sure-Fire Trading Systems (VectorVest, Inc.)
- Trading as a Business Workshop
- VectorVest 7 EOD
- VectorVest 7 RealTime/IntraDay
- VectorVest AutoTester
- VectorVest Educational Services
- VectorVest OnLine
- VectorVest Options Analyzer
- VectorVest ProGraphics v6.0
- VectorVest ProTrader 7
- VectorVest RealTime Derby Tool
- VectorVest Simulator
- VectorVest Variator
- VectorVest Watchdog
