

HOT TOPICS LIST
- MACD
- Fibonacci
- RSI
- Gann
- ADXR
- Stochastics
- Volume
- Triangles
- Futures
- Cycles
- Volatility
- ZIGZAG
- MESA
- Retracement
- Aroon
INDICATORS LIST
LIST OF TOPICS
PRINT THIS ARTICLE
by Matt Blackman
I've written four bearish articles about AAPL since November 2012. But lately the chart has been looking a lot less gloomy.
Position: Hold
Matt Blackman
Matt Blackman is a full-time technical and financial writer and trader. He produces corporate and financial newsletters, and assists clients in getting published in the mainstream media. He is the host of TradeSystemGuru.com. Matt has earned the Chartered Market Technician (CMT) designation. Find out what stocks and futures Matt is watching on Twitter at www.twitter.com/RatioTrade
PRINT THIS ARTICLE
BULL/BEAR MARKET
Is Apple Near A Bottom?
03/04/13 01:55:44 PMby Matt Blackman
I've written four bearish articles about AAPL since November 2012. But lately the chart has been looking a lot less gloomy.
Position: Hold
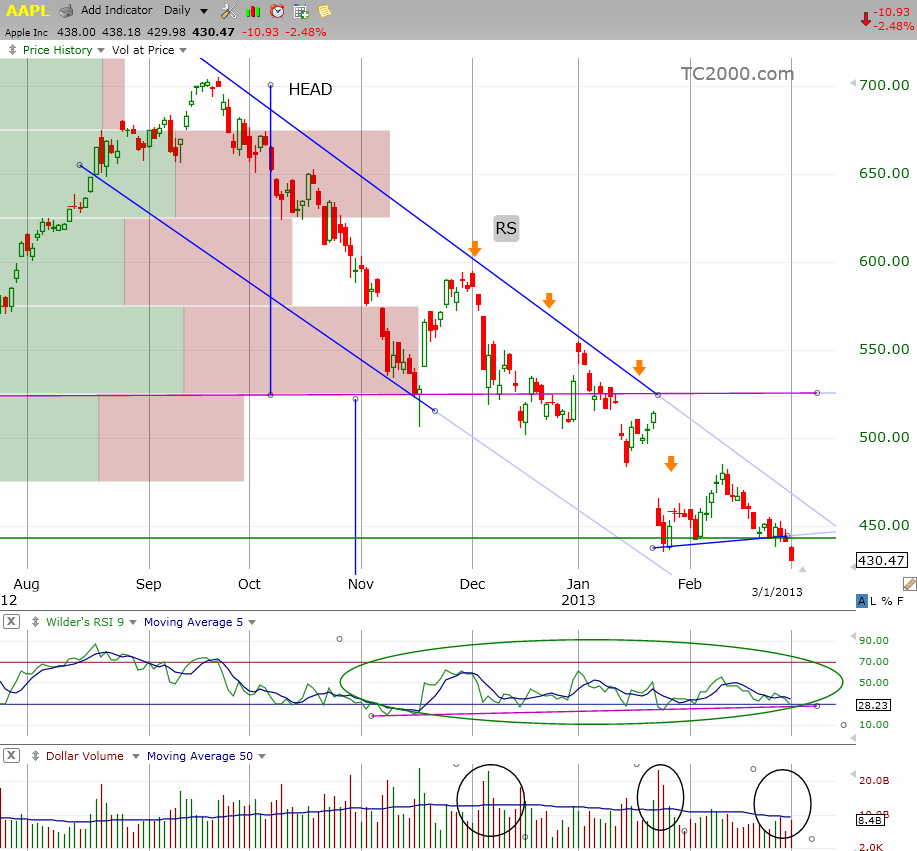
| Since peaking in September 2012, Apple bulls have suffered a bumpy, uncomfortable ride down the slope of hope. In my previous four bearish articles (see orange down arrows in Figure 1), I discussed why I believed that stock had further to fall. However, lately, the chart outlook has gotten decidedly brighter. |
|
| Figure 1 � Daily chart of Apple Inc showing distinct down-trend channel but note the declining selling volume in the lower subgraph together with the positive divergence exhibited between the RSI (middle price graph) and price. |
| Graphic provided by: TC2000.com. |
| |
| First, a capitulation of sorts is occurring with regards to selling volume (see three circles in volume graph). Note that each time AAPL has dropped since December 2012, selling volume has declined which shows exhaustion in selling pressure. Secondly, note the positive divergence between the RSI (middle subgraph) and price. Although AAPL stock broke uptrend support on March 1, the RSI did not (see magenta line in middle subgraph). |
|
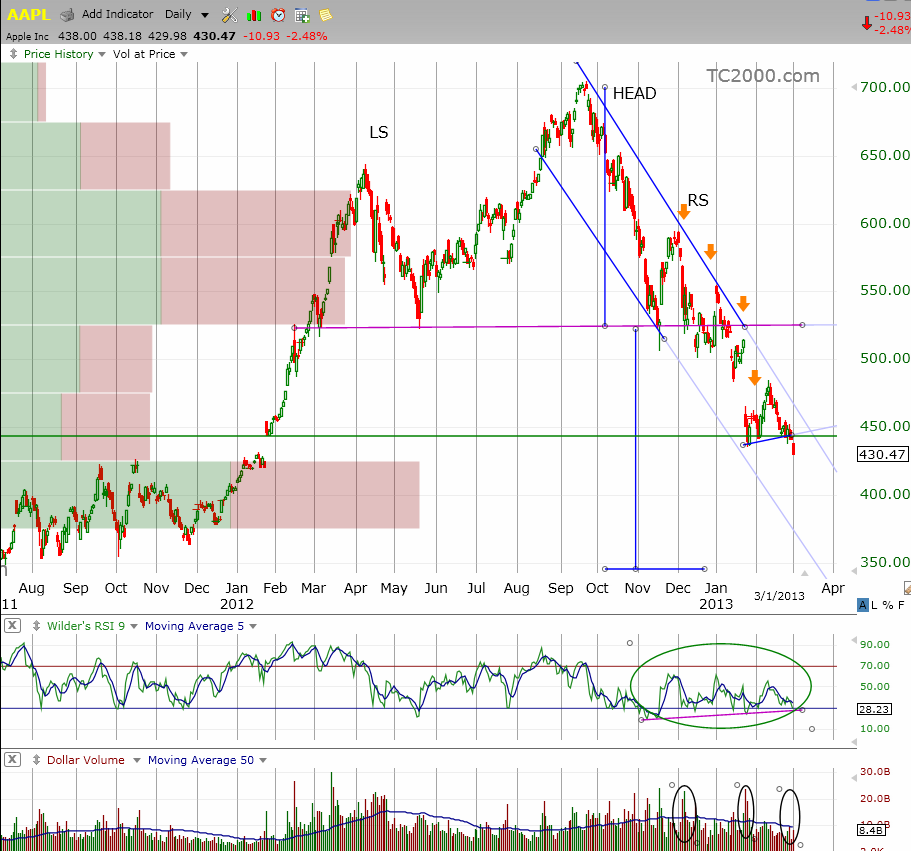
| Figure 2 � Longer term chart of AAPL showing the large bearish Head & Shoulders top pattern in the stock with a minimum pattern projected target of $346. |
| Graphic provided by: TC2000.com. |
| |
| On the macro-market front, another reason for feeling more bullish is that even though economic data in the U.S. and around the globe has been deteriorating as evidenced by the weak Q4-2012 GDP readings, the seemingly endless supply of quantitative easing by a myriad of central banks around the globe has done much to keep equity prices aloft. In lieu of a major correction, this government-mandated fiscal pumping should help keep a structural put under stock prices. |
| In other words, unless governments come to their collective senses all of a sudden and realize the risks of trying to print their way to economic prosperity, expect this flood to continue. So unless more skeletons pop out of the Apple closet, don't expect the minimum projected head and shoulders price target of $346 to be reached anytime soon. |
| One note of caution - unlike parabolic blowoff tops that can reverse in a heartbeat, bottoms are generally long protracted events which can take weeks or even months to form. As well, Apple stock still has a number of challenges ahead, the latest of which is a mandated re-trial of its billion-dollar plus patent case with arch rival Samsung. But given the changing technicals and as long as the stock continues to experience accumulation accompanied by a cessation of selling pressure, a bottom can't be far behind. |
Matt Blackman is a full-time technical and financial writer and trader. He produces corporate and financial newsletters, and assists clients in getting published in the mainstream media. He is the host of TradeSystemGuru.com. Matt has earned the Chartered Market Technician (CMT) designation. Find out what stocks and futures Matt is watching on Twitter at www.twitter.com/RatioTrade
| Company: | TradeSystemGuru.com |
| Address: | Box 2589 |
| Garibaldi Highlands, BC Canada | |
| Phone # for sales: | 604-898-9069 |
| Fax: | 604-898-9069 |
| Website: | www.tradesystemguru.com |
| E-mail address: | indextradermb@gmail.com |
Traders' Resource Links | |
| TradeSystemGuru.com has not added any product or service information to TRADERS' RESOURCE. | |
Click here for more information about our publications!
Comments

Request Information From Our Sponsors
- VectorVest, Inc.
- Executive Premier Workshop
- One-Day Options Course
- OptionsPro
- Retirement Income Workshop
- Sure-Fire Trading Systems (VectorVest, Inc.)
- Trading as a Business Workshop
- VectorVest 7 EOD
- VectorVest 7 RealTime/IntraDay
- VectorVest AutoTester
- VectorVest Educational Services
- VectorVest OnLine
- VectorVest Options Analyzer
- VectorVest ProGraphics v6.0
- VectorVest ProTrader 7
- VectorVest RealTime Derby Tool
- VectorVest Simulator
- VectorVest Variator
- VectorVest Watchdog
- StockCharts.com, Inc.
- Candle Patterns
- Candlestick Charting Explained
- Intermarket Technical Analysis
- John Murphy on Chart Analysis
- John Murphy's Chart Pattern Recognition
- John Murphy's Market Message
- MurphyExplainsMarketAnalysis-Intermarket Analysis
- MurphyExplainsMarketAnalysis-Visual Analysis
- StockCharts.com
- Technical Analysis of the Financial Markets
- The Visual Investor