HOT TOPICS LIST
- MACD
- Fibonacci
- RSI
- Gann
- ADXR
- Stochastics
- Volume
- Triangles
- Futures
- Cycles
- Volatility
- ZIGZAG
- MESA
- Retracement
- Aroon
INDICATORS LIST
LIST OF TOPICS
PRINT THIS ARTICLE
by Koos van der Merwe
We are always on the lookout for a share that shows promise.
Position: Sell
Koos van der Merwe
Has been a technical analyst since 1969, and has worked as a futures and options trader with First Financial Futures in Johannesburg, South Africa.
PRINT THIS ARTICLE
ELLIOTT WAVE
A Look At Walt Disney Co.
03/01/13 02:58:55 PMby Koos van der Merwe
We are always on the lookout for a share that shows promise.
Position: Sell
| Upcoming Events and Presentations: The Walt Disney Company's 2013 Annual Meeting of Shareholders will be presented via live audio Webcast on Wednesday, March 6, 2013 at 9.00 a.m. PST / 12:00 p.m.EST The Webcast will be streamed via Flash and Windows media Player.... With this announcement due, do you anticipate an excellent report or do you wait for an announcement and only then decide whether to buy or not? What do the charts tell us? |

|
| Figure 1 Weekly Chart |
| Graphic provided by: AdvancedGET. |
| |
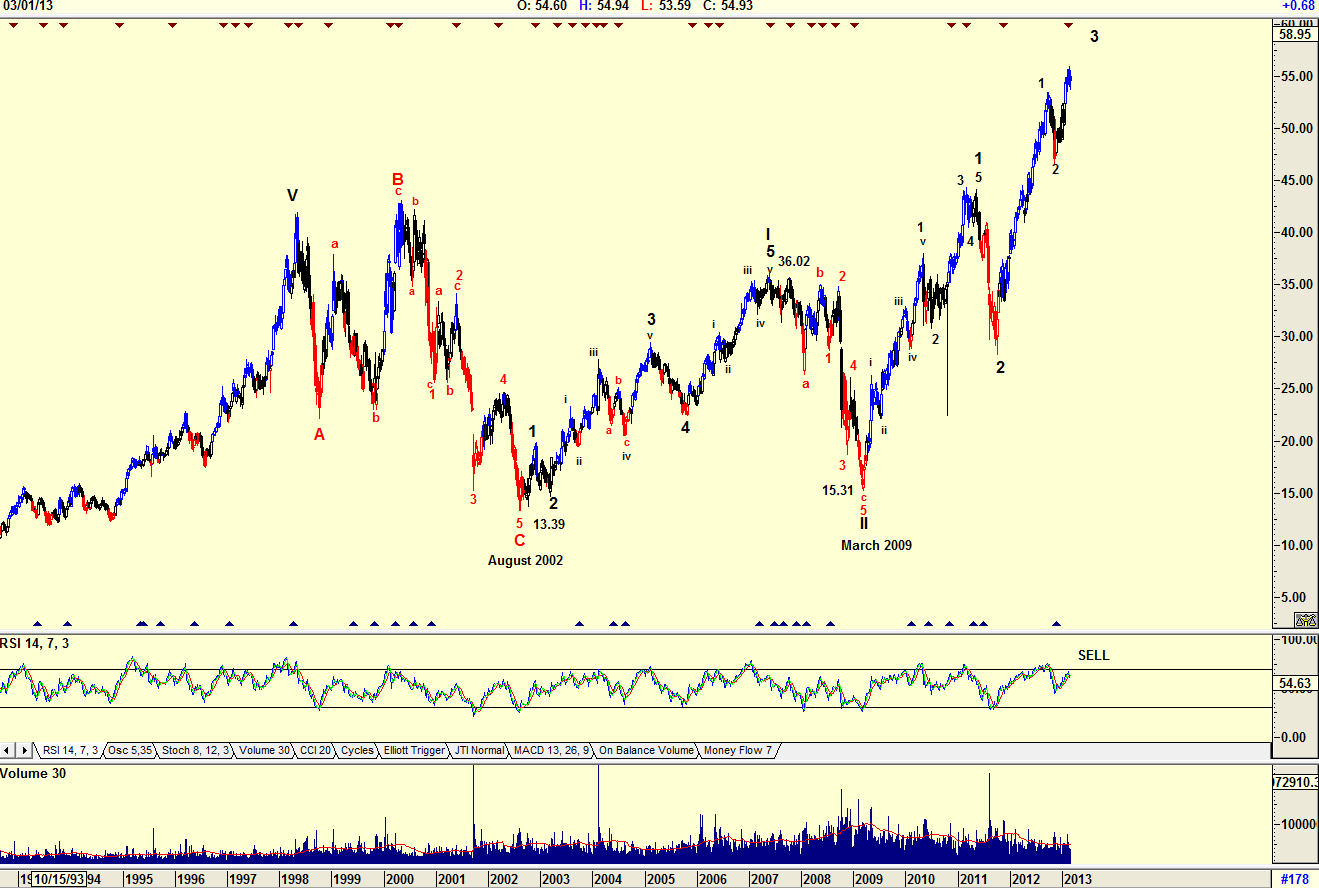
| My first chart in Figure 1 is an Elliott Wave count of a weekly chart of Walt Disney Co. (DIS). The chart shows that a major C Wave bottomed in August 2002 at $13.39. The price then rose in a Wave I and fell in a Wave II to $15.31 by March 2009. From this low, the share price has risen in a Wave 1 and corrected in a Wave 2 of Wave III. It is now in the process of tracing a wave 3 of Wave 3 of Wave III. Elliott wave analysis suggests that a wave 3 is the strongest bull market wave there is. A wave 3 of Wave 3 of Wave III is therefore a major bull trend. Of course the odd correction will occur, but that correction offers a buying opportunity. Those buyers who bought at $15.31 in March 2009 are presently smiling all the way to the bank. |

|
| Figure 2 Daily Chart |
| Graphic provided by: AdvancedGET. |
| |
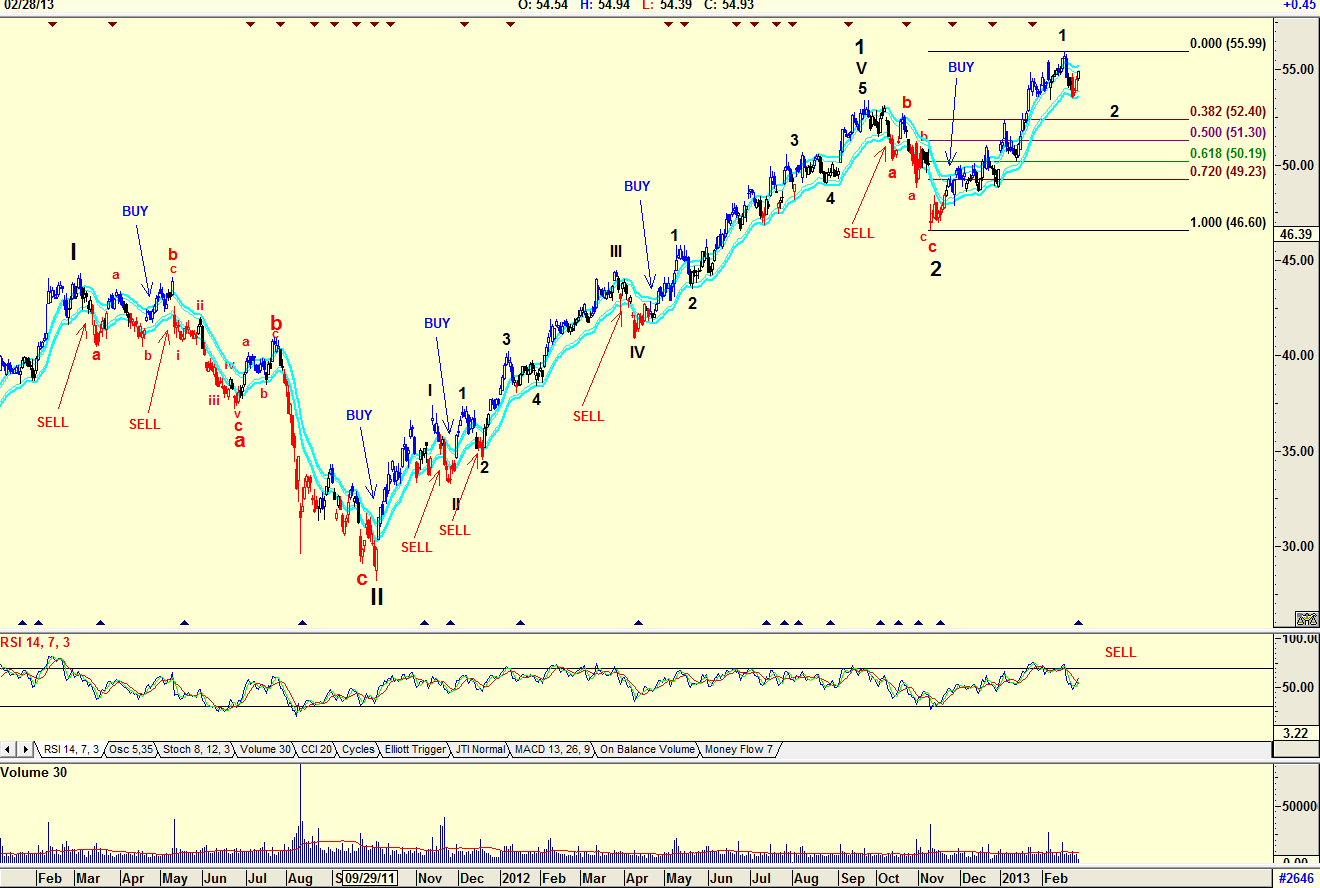
| The chart in Figure 2 is a daily chart, suggesting that a wave 2 of Wave 3 of Wave III is in force. A wave two retracement can be 100% of the rise of a wave one, so we use the RSI indicator to trigger a buy signal. The RSI indicator has given a sell signal and is trending down. Do note that the price tested the JM Internal Band indicator (blue channel lines on charts), but did not suggest a sell. The JM Internal band is a 15-period simple moving average offset by 2% positive and 2% negative. A move above the upper band suggests a buy signal and a move below the lower band suggests a sell signal. |

|
| Figure 3 Daily Chart |
| Graphic provided by: AdvancedGET. |
| |
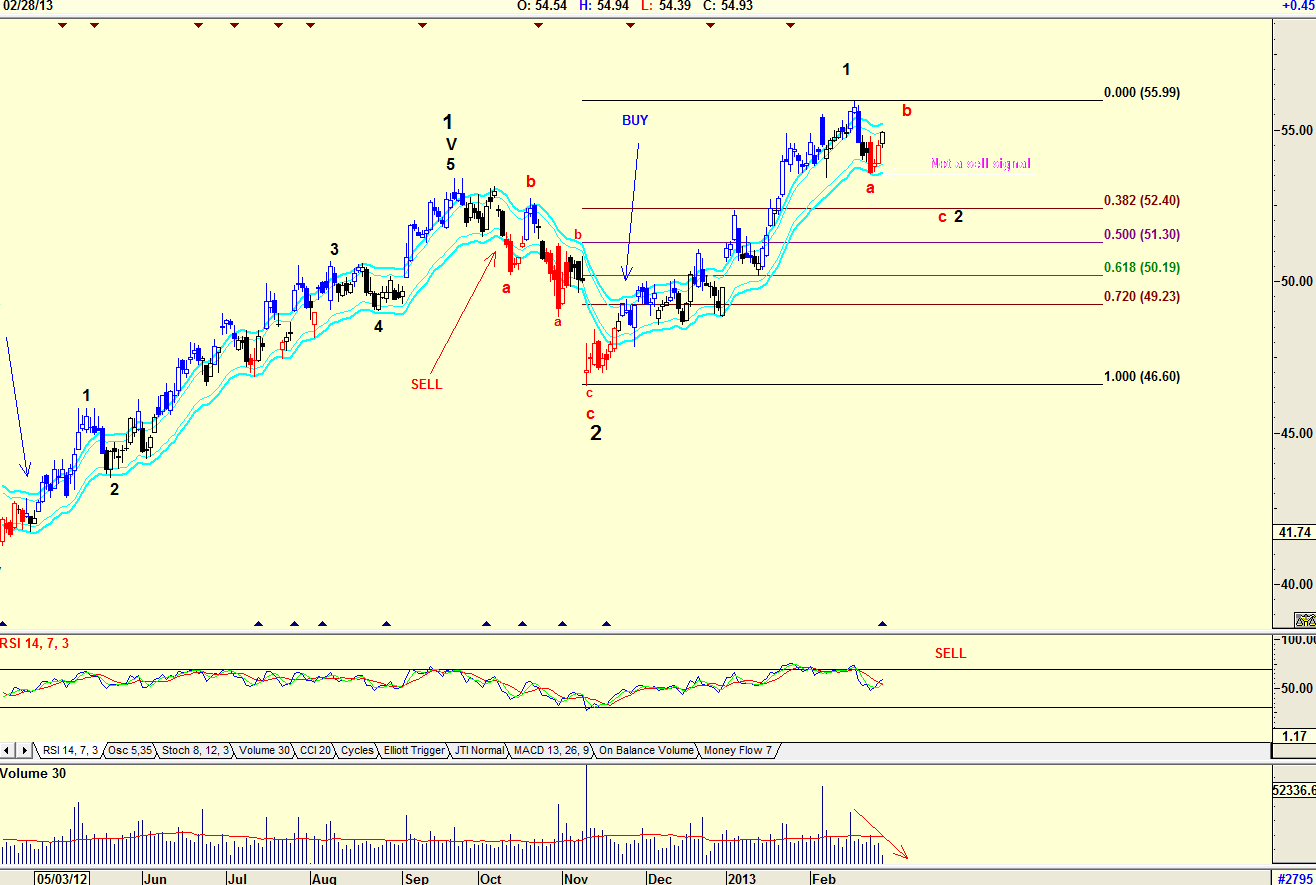
| Figure 3 is also the daily chart but enlarged. Note that the price did not penetrate the lower band of the JM internal band indicator. Note also that as the price rose over the last three days, volume fell. Falling volume on a rising trend suggests weakness. When the price breaks below the lower JM internal Band you can take a short position. I would not be a buyer of DIS at the moment. I would wait for the RSI indicator to signal a buy signal, or for the price to break below the lower JM internal band and then break above the upper band. |
Has been a technical analyst since 1969, and has worked as a futures and options trader with First Financial Futures in Johannesburg, South Africa.
| Address: | 3256 West 24th Ave |
| Vancouver, BC | |
| Phone # for sales: | 6042634214 |
| E-mail address: | petroosp@gmail.com |
Click here for more information about our publications!
PRINT THIS ARTICLE

|

Request Information From Our Sponsors
- VectorVest, Inc.
- Executive Premier Workshop
- One-Day Options Course
- OptionsPro
- Retirement Income Workshop
- Sure-Fire Trading Systems (VectorVest, Inc.)
- Trading as a Business Workshop
- VectorVest 7 EOD
- VectorVest 7 RealTime/IntraDay
- VectorVest AutoTester
- VectorVest Educational Services
- VectorVest OnLine
- VectorVest Options Analyzer
- VectorVest ProGraphics v6.0
- VectorVest ProTrader 7
- VectorVest RealTime Derby Tool
- VectorVest Simulator
- VectorVest Variator
- VectorVest Watchdog
- StockCharts.com, Inc.
- Candle Patterns
- Candlestick Charting Explained
- Intermarket Technical Analysis
- John Murphy on Chart Analysis
- John Murphy's Chart Pattern Recognition
- John Murphy's Market Message
- MurphyExplainsMarketAnalysis-Intermarket Analysis
- MurphyExplainsMarketAnalysis-Visual Analysis
- StockCharts.com
- Technical Analysis of the Financial Markets
- The Visual Investor
