HOT TOPICS LIST
- MACD
- Fibonacci
- RSI
- Gann
- ADXR
- Stochastics
- Volume
- Triangles
- Futures
- Cycles
- Volatility
- ZIGZAG
- MESA
- Retracement
- Aroon
INDICATORS LIST
LIST OF TOPICS
PRINT THIS ARTICLE
by Chaitali Mohile
Will Ingersoll-Rand establish support at its 52-week high?
Position: N/A
Chaitali Mohile
Active trader in the Indian stock markets since 2003 and a full-time writer. Trading is largely based upon technical analysis.
PRINT THIS ARTICLE
TECHNICAL ANALYSIS
IR At 52-Week High
02/28/13 08:45:27 AMby Chaitali Mohile
Will Ingersoll-Rand establish support at its 52-week high?
Position: N/A
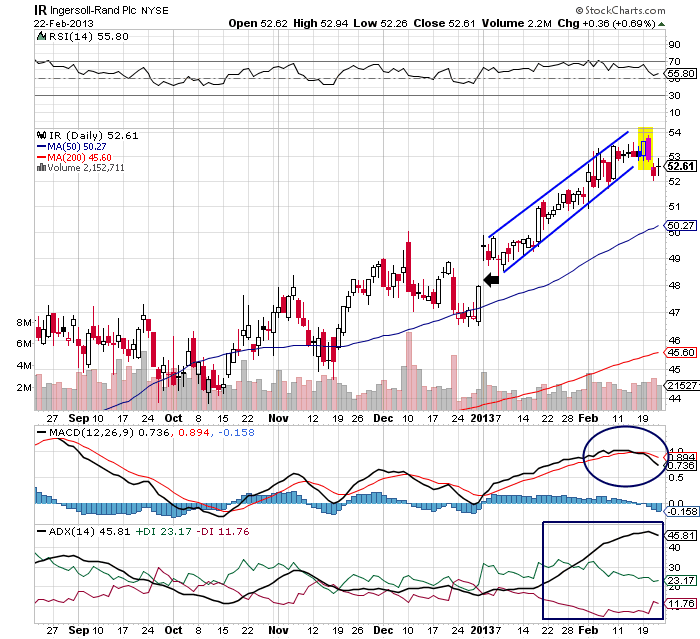
| As you can see from the daily chart of Ingersoll-Rand (IR) in Figure 1, the bullish rally in the stock was accompanied by an ascending 50-day moving average (MA). After a small gap up, the stock surged, hitting new levels. Notice that as the stock was heading toward its 52-week high, bullish strength diminished. Though price surged, the relative strength index (RSI) (14) continued to move horizontally between 50 and 70 levels. The oscillator failed to climb into an overbought zone. Although the RSI (14) is bullish, it has to rise above its 70 levels to bring in more bulls. The negative divergence highlighted by the oscillator is likely to discourage the rally. A bearish engulfing candlestick pattern formed (Figure 1), which indicates upcoming bearish pressure in IR. |

|
| FIGURE 1: IR, DAILY. |
| Graphic provided by: StockCharts.com. |
| |
| The average directional index (ADX) (14) looks like it is ready to plunge from an overheated uptrend region. The moving average convergence/divergence (MACD) (12,26,9) was highly volatile throughout the price rally. The gap between the MACD line and trigger line was very narrow, indicating weak momentum. The MACD (12,26,9) has undergone a bearish crossover in positive territory. An intermediate descending rally could be in the works. |
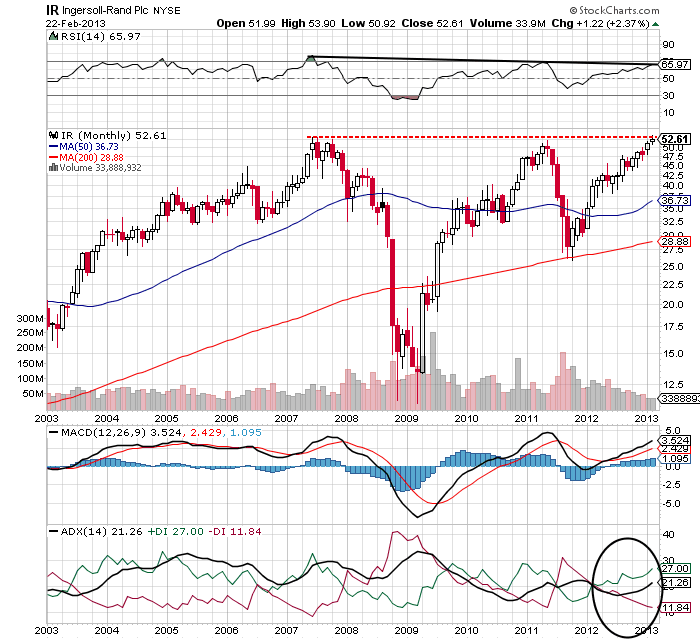
| On the monthly chart in Figure 2, IR has formed a double top at 52.61, which is a 52-week high. A triple top appears to be forming. Due to uncertainty among the traders, the stock is likely to become volatile at this level. The RSI (14) has never crossed the 70 levels. The MACD (12,26,9) was extremely positive, so it is likely to reverse in positive territory. In 2008, the indicator slipped into negative region from the same levels. The MACD appears to face resistance when it hits a value of 5. Considering its past performance, the MACD (12,26,9) is likely to terminate its upwards journey. |

|
| FIGURE 2: IR, MONTHLY. |
| Graphic provided by: StockCharts.com. |
| |
| The developing uptrend indicated by the ADX (14) is the only positive indicator in Figure 2. But this single indicator could not pull IR above the 52-week high. The stock is likely to face bearish pressure at 52.61 levels. Since the second low was formed with the support of the 200-period moving average (MA), the third low is likely to establish support near or above the 50-period MA. |
| To conclude, keep a close watch on the 52-week high. Is IR going to break out above resistance or will it retrace to its 50-period MA? |
Active trader in the Indian stock markets since 2003 and a full-time writer. Trading is largely based upon technical analysis.
| Company: | Independent |
| Address: | C1/3 Parth Indraprasth Towers. Vastrapur |
| Ahmedabad, Guj 380015 | |
| E-mail address: | chaitalimohile@yahoo.co.in |
Traders' Resource Links | |
| Independent has not added any product or service information to TRADERS' RESOURCE. | |
Click here for more information about our publications!
Comments

Request Information From Our Sponsors
- StockCharts.com, Inc.
- Candle Patterns
- Candlestick Charting Explained
- Intermarket Technical Analysis
- John Murphy on Chart Analysis
- John Murphy's Chart Pattern Recognition
- John Murphy's Market Message
- MurphyExplainsMarketAnalysis-Intermarket Analysis
- MurphyExplainsMarketAnalysis-Visual Analysis
- StockCharts.com
- Technical Analysis of the Financial Markets
- The Visual Investor
- VectorVest, Inc.
- Executive Premier Workshop
- One-Day Options Course
- OptionsPro
- Retirement Income Workshop
- Sure-Fire Trading Systems (VectorVest, Inc.)
- Trading as a Business Workshop
- VectorVest 7 EOD
- VectorVest 7 RealTime/IntraDay
- VectorVest AutoTester
- VectorVest Educational Services
- VectorVest OnLine
- VectorVest Options Analyzer
- VectorVest ProGraphics v6.0
- VectorVest ProTrader 7
- VectorVest RealTime Derby Tool
- VectorVest Simulator
- VectorVest Variator
- VectorVest Watchdog
