HOT TOPICS LIST
- MACD
- Fibonacci
- RSI
- Gann
- ADXR
- Stochastics
- Volume
- Triangles
- Futures
- Cycles
- Volatility
- ZIGZAG
- MESA
- Retracement
- Aroon
INDICATORS LIST
LIST OF TOPICS
PRINT THIS ARTICLE
by Gary Grosschadl
As the markets struggle for direction, traders are seeing plenty of pullback tests, showing what a crucial spot we are in.
Position: N/A
Gary Grosschadl
Independent Canadian equities trader and technical analyst based in Peterborough
Ontario, Canada.
PRINT THIS ARTICLE
The Abundance Of Pullback Tests
08/08/02 08:05:43 AMby Gary Grosschadl
As the markets struggle for direction, traders are seeing plenty of pullback tests, showing what a crucial spot we are in.
Position: N/A
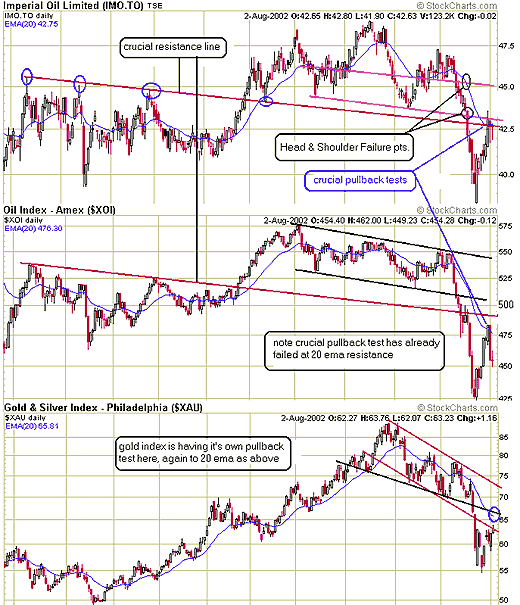
| Lately I have been examining gold and oil and this chart view below ties it all together nicely. In it there are several pattern failures all resulting in important pullback tests. The top chart shows a slanted head and shoulders failure. Note that the 20-day EMA line confirms the pattern failure. The next chart shows a channel failure to the downside as the oil index suffers a big correction. Finally the XAU chart shows a harder to see slanted head and shoulders failure (black line on chart indicates the neckline) and a channel or flag type failure. |
| An interesting note to all three charts is the 20-day EMA line. Often when stocks/indices turn bearish (you can see this on all time frames including intraday), the 20-day EMA line acts as resistance. Failure to beat or stay above this line becomes a future benchmark where bear rallies often fail. |

|
| Graphic provided by: stockcharts.com. |
| |
| Note how the oil index has already failed at the 20-day EMA, suggesting that oil stocks such as T.IMO may quickly follow. Looking at the gold index chart, you have to wonder if it is next in line for similar failure. Not all pullback tests are destined to fail but success or failure here can be very tradeable to the bold and alert trader. |
| While on the subject of oil and gold, it would be prudent to mention a wildcard scenario. Should mideast war break out or tensions escalate to new heights, a major terrorist action occur, or some other unforseen calamity, these two commodities could easily spike upwards. In the meantime I am leaning toward a bearish bias for the two oil charts until proven otherwise. The gold chart is more positive as it still looks to have a bit more upside to the 65 - 68 zone, however traders here may want to dance closer to the exits. |
Independent Canadian equities trader and technical analyst based in Peterborough
Ontario, Canada.
| Website: | www.whatsonsale.ca/financial.html |
| E-mail address: | gwg7@sympatico.ca |
Click here for more information about our publications!
Comments
Date: 08/13/02Rank: 4Comment:
Date: 08/15/02Rank: 5Comment:

Request Information From Our Sponsors
- VectorVest, Inc.
- Executive Premier Workshop
- One-Day Options Course
- OptionsPro
- Retirement Income Workshop
- Sure-Fire Trading Systems (VectorVest, Inc.)
- Trading as a Business Workshop
- VectorVest 7 EOD
- VectorVest 7 RealTime/IntraDay
- VectorVest AutoTester
- VectorVest Educational Services
- VectorVest OnLine
- VectorVest Options Analyzer
- VectorVest ProGraphics v6.0
- VectorVest ProTrader 7
- VectorVest RealTime Derby Tool
- VectorVest Simulator
- VectorVest Variator
- VectorVest Watchdog
- StockCharts.com, Inc.
- Candle Patterns
- Candlestick Charting Explained
- Intermarket Technical Analysis
- John Murphy on Chart Analysis
- John Murphy's Chart Pattern Recognition
- John Murphy's Market Message
- MurphyExplainsMarketAnalysis-Intermarket Analysis
- MurphyExplainsMarketAnalysis-Visual Analysis
- StockCharts.com
- Technical Analysis of the Financial Markets
- The Visual Investor
