HOT TOPICS LIST
- MACD
- Fibonacci
- RSI
- Gann
- ADXR
- Stochastics
- Volume
- Triangles
- Futures
- Cycles
- Volatility
- ZIGZAG
- MESA
- Retracement
- Aroon
INDICATORS LIST
LIST OF TOPICS
PRINT THIS ARTICLE
by Koos van der Merwe
Texas Instruments increased its dividend. Is it a buy?
Position: Buy
Koos van der Merwe
Has been a technical analyst since 1969, and has worked as a futures and options trader with First Financial Futures in Johannesburg, South Africa.
PRINT THIS ARTICLE
ELLIOTT WAVE
Texas Instruments A Buy?
02/26/13 12:09:21 PMby Koos van der Merwe
Texas Instruments increased its dividend. Is it a buy?
Position: Buy
| Without doubt, in an uncertain market, money drifts towards dividend paying stocks. With the average investor uncertain of market direction - never forget they only start buying when the market tops out - buying a stock that pays a good dividend is one way they feel will cover losses they may face in the future. So when a stock announces that it is increasing its dividend, two things come to mind. 1. The company must be showing good profits to increase their dividend. 2. Nice to own a stock that is paying a pleasant dividend and hopefully one that can score on growth as well. |

|
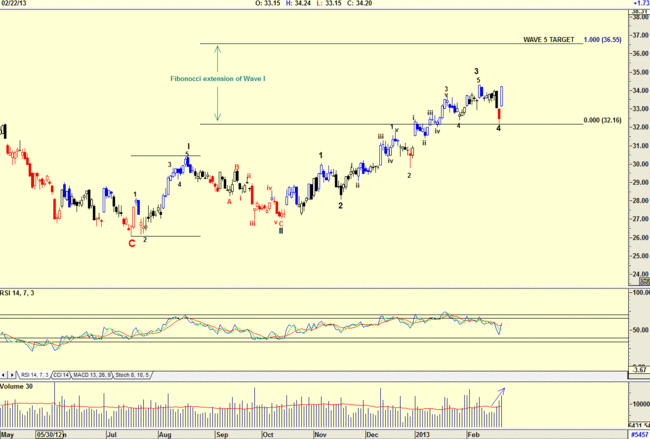
| Fig 1. A daily chart of Texas Instruments showing Elliott Wave count and Fibonocci Extension target |
| Graphic provided by: AdvancedGET. |
| |
| The chart in Figure 1 is a daily chart of Texas Instruments and shows how the price has risen in an Elliott Wave count. The chart is suggesting that the price is moving into a Wave 5 with a target of $36.55. This target is based on the Elliott Wave rule that a wave 5 should be equal to the length of Wave 1. The target is then set using a Fibonocci extension pattern. Do note the RSI, which is still weakening. Also note the volume which rose as the price fell, and then continued rising as the price rose with the announcement of the dividend increase. This tells us that the board of Texas Instruments kept their intentions very secret. |

|
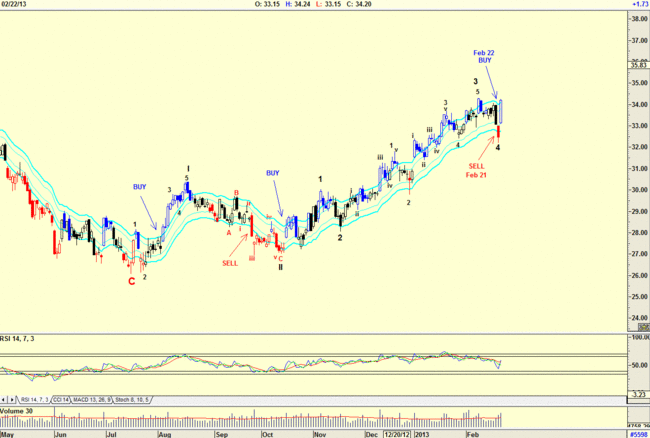
| Figure 2. Daily chart of Texas Instruments showing a BUY signal given on a JM Internal Band indicator |
| Graphic provided by: AdvancedGET. |
| |
| Looking at the chart using the JM Internal Band indicator we see that a sell signal was given on February 21, 2013 as the closing price broke below the lower band, and a buy signal was given on February 22, 2013 as the closing price broke above the upper band. The JM Internal Band indicator is a simple 15-period moving average offset by 2% positive and -2% negative. With chart of Texas Instruments suggesting a buy signal based on an Elliott Wave count, and a buy signal based on the JM Internal Band indicator, I would be a buyer of the stock. |
Has been a technical analyst since 1969, and has worked as a futures and options trader with First Financial Futures in Johannesburg, South Africa.
| Address: | 3256 West 24th Ave |
| Vancouver, BC | |
| Phone # for sales: | 6042634214 |
| E-mail address: | petroosp@gmail.com |
Click here for more information about our publications!
PRINT THIS ARTICLE

|

Request Information From Our Sponsors
- VectorVest, Inc.
- Executive Premier Workshop
- One-Day Options Course
- OptionsPro
- Retirement Income Workshop
- Sure-Fire Trading Systems (VectorVest, Inc.)
- Trading as a Business Workshop
- VectorVest 7 EOD
- VectorVest 7 RealTime/IntraDay
- VectorVest AutoTester
- VectorVest Educational Services
- VectorVest OnLine
- VectorVest Options Analyzer
- VectorVest ProGraphics v6.0
- VectorVest ProTrader 7
- VectorVest RealTime Derby Tool
- VectorVest Simulator
- VectorVest Variator
- VectorVest Watchdog
- StockCharts.com, Inc.
- Candle Patterns
- Candlestick Charting Explained
- Intermarket Technical Analysis
- John Murphy on Chart Analysis
- John Murphy's Chart Pattern Recognition
- John Murphy's Market Message
- MurphyExplainsMarketAnalysis-Intermarket Analysis
- MurphyExplainsMarketAnalysis-Visual Analysis
- StockCharts.com
- Technical Analysis of the Financial Markets
- The Visual Investor
