HOT TOPICS LIST
- MACD
- Fibonacci
- RSI
- Gann
- ADXR
- Stochastics
- Volume
- Triangles
- Futures
- Cycles
- Volatility
- ZIGZAG
- MESA
- Retracement
- Aroon
INDICATORS LIST
LIST OF TOPICS
PRINT THIS ARTICLE
by Donald W. Pendergast, Jr.
Shares of Key Energy Services staged a steady 11-week rally between November 2012 and February 2013, but more sideways or downside action is likely before another leg higher can commence.
Position: N/A
Donald W. Pendergast, Jr.
Freelance financial markets writer and online publisher of the Trendzetterz.com S&P 500 Weekly Forecast service.
PRINT THIS ARTICLE
KEG Consolidating Until The Next Rally?
02/25/13 08:33:15 AMby Donald W. Pendergast, Jr.
Shares of Key Energy Services staged a steady 11-week rally between November 2012 and February 2013, but more sideways or downside action is likely before another leg higher can commence.
Position: N/A
| Key Energy Services (KEG) may not be as well known as its larger-cap peers (HAL, SLB, TIG, BHI) in the oil services industry group, but it still offers skilled traders/investors frequent opportunities to get onboard high-probability swing and/or trending moves with great regularity. At the moment, KEG is pulling back sharply toward its 50-day exponential moving average (EMA) even as its oil services brethren continue to fall from multimonth highs, but the stock's true state of technical health is actually very positive in the longer term. Here's a closer look now (Figures 1 and 2). |

|
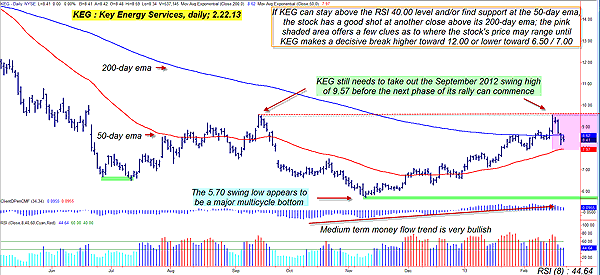
| FIGURE 1: KEG, DAILY. With several money flow histograms already confirming substantial accumulation in KEG, bulls may want to prepare for yet another break above the eight-period RSI level of 60.00, which may launch a tradable swing move toward the 10.00 area. |
| Graphic provided by: TradeStation. |
| |
| KEG plunged by more than 68% from its February 2012 high of 18.18, declining rapidly (in two major bearish waves) to hit the bargain-basement low of 5.70 per share in early November 2012 (Figure 1). That's when a major multicycle low was confirmed in the stock, with a steady rise up from the bottom seen over the next 14 weeks -- good for a 40% gain. Some interesting things also occurred after the major low was made in November 2012: 1. The 34-day Chaikin money flow histogram trend turned bullish. 2. The 100-day Chaikin money flow histogram confirmed that the smart money was accumulating substantial positions in the stock. 3. The spread between KEG's 50- and 200-day EMAs began to narrow, with the spread now being at its smallest level in more than 7-1/2 months. In fact, the blue 200-day EMA actually flattened out, setting up the stage for a possible golden cross of the red 50-day EMA above it in the weeks ahead. All told, energy service stock bulls can use this basic chart as a confirming tool to gauge the strength of this long-term bullish trend reversal in KEG, and the picture painted thus far suggests that the big money players (mutual funds and so on) are convinced that KEG's share price will be substantially higher in the second half of 2013 than it is right now. Shorter-term traders, however, should focus on any swings that set up within the pink shaded area on the chart, as this will be a primary battle zone for bulls and bears, one that when resolved will determine KEG's next significant rally phase. |

|
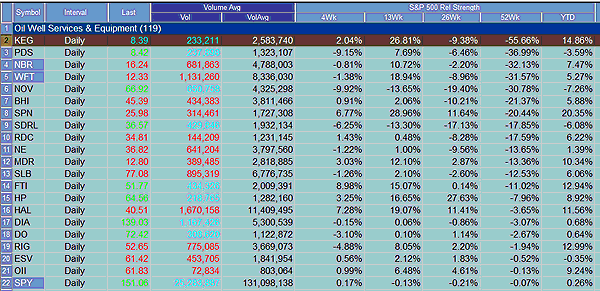
| FIGURE 2: RELATIVE STRENGTH. KEG has excellent 13-week comparative relative strength vs. the .SPX, but is severely lagging in the 52-week performance category. |
| Graphic provided by: TradeStation. |
| Graphic provided by: TradeStation Radar Screen. |
| |
| The eight-day relative strength index (RSI) histogram at the very bottom of the chart is a key tool that bulls and bears alike can use to determine which way KEG may break. Readings below 40.00 indicate that the bears are in control, while readings above 60.00 confirm that the bulls are in control; readings between 40 and 60 indicates some sort of consolidation is under way. Currently, the RSI histogram reading is 44.64, and with KEG trading a bit higher than its 50-day EMA right now, this is not a time to be actively shorting this stock. In fact, even though daily based swing traders should simply wait for a break above/below 60/40 to get them into their next positions, intraday traders using 30- to 60-minute charts should have little problem in locating attractive setups on these smaller time frames, using the same RSI 60/40 logic to help time their long or short trade entries. However, even these shorter-term swing traders need to keep abreast of the KEG's daily RSI 60/40 status so they don't get blindsided if a sudden rally or selloff commences on the daily time frame chart. Daily based swing traders should always keep their trade risks at 2% or less of account equity, while shorter-term traders should strive to keep risks between 0.5 and 1%. |
| Summing up, it appears likely that KEG is going to have some period of consolidation ahead, with the most probable outcome being a continuation higher of the rally that commenced in November 2012. With bullish money flow trends indicating accumulation by big-money traders and institutions, now could be a good time for oil services bulls to start preparing for a possible strong rally in KEG heading into the second quarter of 2013. |
Freelance financial markets writer and online publisher of the Trendzetterz.com S&P 500 Weekly Forecast service.
| Title: | Market consultant and writer |
| Company: | Trendzetterz |
| Address: | 81 Hickory Hollow Drive |
| Crossville, TN 38555 | |
| Phone # for sales: | 904-303-4814 |
| Website: | trendzetterz.com |
| E-mail address: | support@trendzetterz.com |
Traders' Resource Links | |
| Trendzetterz has not added any product or service information to TRADERS' RESOURCE. | |
Click here for more information about our publications!
PRINT THIS ARTICLE

Request Information From Our Sponsors
- StockCharts.com, Inc.
- Candle Patterns
- Candlestick Charting Explained
- Intermarket Technical Analysis
- John Murphy on Chart Analysis
- John Murphy's Chart Pattern Recognition
- John Murphy's Market Message
- MurphyExplainsMarketAnalysis-Intermarket Analysis
- MurphyExplainsMarketAnalysis-Visual Analysis
- StockCharts.com
- Technical Analysis of the Financial Markets
- The Visual Investor
- VectorVest, Inc.
- Executive Premier Workshop
- One-Day Options Course
- OptionsPro
- Retirement Income Workshop
- Sure-Fire Trading Systems (VectorVest, Inc.)
- Trading as a Business Workshop
- VectorVest 7 EOD
- VectorVest 7 RealTime/IntraDay
- VectorVest AutoTester
- VectorVest Educational Services
- VectorVest OnLine
- VectorVest Options Analyzer
- VectorVest ProGraphics v6.0
- VectorVest ProTrader 7
- VectorVest RealTime Derby Tool
- VectorVest Simulator
- VectorVest Variator
- VectorVest Watchdog
