HOT TOPICS LIST
- MACD
- Fibonacci
- RSI
- Gann
- ADXR
- Stochastics
- Volume
- Triangles
- Futures
- Cycles
- Volatility
- ZIGZAG
- MESA
- Retracement
- Aroon
INDICATORS LIST
LIST OF TOPICS
PRINT THIS ARTICLE
by Donald W. Pendergast, Jr.
Off to an incredibly bullish start for 2013, shares of Goldman Sachs may be getting very close to a medium-term top.
Position: N/A
Donald W. Pendergast, Jr.
Freelance financial markets writer and online publisher of the Trendzetterz.com S&P 500 Weekly Forecast service.
PRINT THIS ARTICLE
KELTNER CHANNELS
Goldman Sachs Trend Reversal Near?
02/22/13 08:32:47 AMby Donald W. Pendergast, Jr.
Off to an incredibly bullish start for 2013, shares of Goldman Sachs may be getting very close to a medium-term top.
Position: N/A
| A month ago, I wrote here in Traders.com Advantage (TCA) that Goldman Sachs (GS) looked like a great covered-call candidate for conservative traders/investors, and the stock apparently agreed with that assessment, rising by nearly 10% in the four weeks since that was written. But now the situation in GS is warranting a new outlook, one that is warning of a significant correction -- one that may have already begun during the morning trading session on February 20, 2013 (Figure 1). Here's a closer look now. |

|
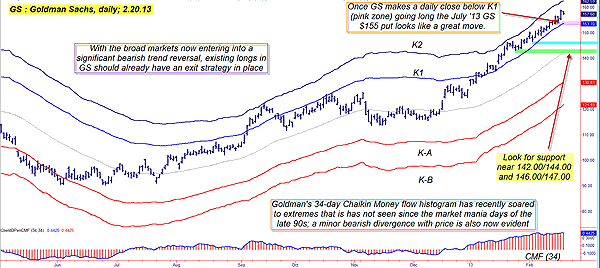
| FIGURE 1: GS, DAILY. The broad US markets appear to be moving into corrective mode as of February 20, 2013; a decline by GS beneath band K1 may offer an excellent opportunity to go long the July '13 GS $155 puts. |
| Graphic provided by: TradeStation. |
| |
| GS is up by about 24% since its final closing price of 2012 and has been trending in a very low volatility channel, right between its two upper Keltner bands. At first glance, little seems to have changed since the last technical evaluation in January 2013. However, several items of major technical importance are strongly suggesting that GS is ripe for a proportional correction and/or bearish trend reversal. Here are several warning signs that this is likely the case: 1. The stock's 34-day Chaikin money flow histogram (bottom of chart) is now at a level that is beyond anything seen in the stock since the late 1990s and is also beginning to manifest a bearish price/money flow divergence, the kind normally seen just before a major correction. 2. The Standard & Poor's 500 (.SPX) has also had a very strong, low-volatility rally and is also overdue for a correction. 3. Goldman's key 80-day price cycle anticipates that the stock will correct down into at least the upper 140.00 range within the next four weeks -- by March 18, 2013. 4. The broad market action on February 20, 2013, is very bearish, with large percentage declines in major large-cap stocks from a variety of sectors. Ford Motor (F) is down nearly 3%, the oil services stocks are already in a bearish trend reversal, Freeport-McMoRan (FCX) is off by more than 4%, and many of Goldman's peers are down by 1% to 2%. Clearly, this is as good a warning as any for current GS longs to start preparing to get out of Dodge (and Ford and GM, too) now, just in case the selling pressure ramps up over the next week or two. |

|
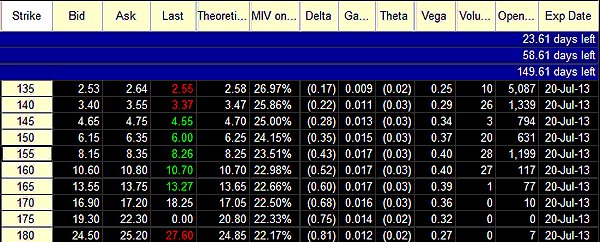
| FIGURE 2: PUTS. The July '13 GS $155 puts have a healthy open interest figure of nearly 1,200 contracts and a decent bid-ask spread. |
| Graphic provided by: TradeStation. |
| Graphic provided by: TradeStation Options Analysis. |
| |
| Playing GS here looks very simple. If you see a daily close below band K1, look to buy at-the-money put options with at least two to three months of time value, looking to capitalize on a high-probability decline toward the $142.00 to $145.00 price range by early March 2013. The Keltner midline is currently at $142.25 and just above that is an area of decent chart support (the January 25, 2013, swing low of $143.30) and either of these price points would serve as great target prices for this anticipated decline in GS. More conservative traders might want to use $147.00 as their price target, as that is a minor support level in the stock. The July '13 GS $155 puts have excellent open interest (nearly 1,200 contracts), a very small amount of daily time decay of $3 per contract (theta) and a decent bid/ask spread (Figure 2); these may be a better choice than the April '13 $155 puts, since you have a much longer time window to play within before daily time decay kicks in. Regardless of which put you choose to buy, be sure to risk no more than 2% of your account value on this or any other trade, knowing that the best and longest-lasting traders always limit their risk, no matter how bullish or bearish a trade setup may appear to be. Trade wisely until we meet here again. |
Freelance financial markets writer and online publisher of the Trendzetterz.com S&P 500 Weekly Forecast service.
| Title: | Market consultant and writer |
| Company: | Trendzetterz |
| Address: | 81 Hickory Hollow Drive |
| Crossville, TN 38555 | |
| Phone # for sales: | 904-303-4814 |
| Website: | trendzetterz.com |
| E-mail address: | support@trendzetterz.com |
Traders' Resource Links | |
| Trendzetterz has not added any product or service information to TRADERS' RESOURCE. | |
Click here for more information about our publications!
PRINT THIS ARTICLE

Request Information From Our Sponsors
- StockCharts.com, Inc.
- Candle Patterns
- Candlestick Charting Explained
- Intermarket Technical Analysis
- John Murphy on Chart Analysis
- John Murphy's Chart Pattern Recognition
- John Murphy's Market Message
- MurphyExplainsMarketAnalysis-Intermarket Analysis
- MurphyExplainsMarketAnalysis-Visual Analysis
- StockCharts.com
- Technical Analysis of the Financial Markets
- The Visual Investor
- VectorVest, Inc.
- Executive Premier Workshop
- One-Day Options Course
- OptionsPro
- Retirement Income Workshop
- Sure-Fire Trading Systems (VectorVest, Inc.)
- Trading as a Business Workshop
- VectorVest 7 EOD
- VectorVest 7 RealTime/IntraDay
- VectorVest AutoTester
- VectorVest Educational Services
- VectorVest OnLine
- VectorVest Options Analyzer
- VectorVest ProGraphics v6.0
- VectorVest ProTrader 7
- VectorVest RealTime Derby Tool
- VectorVest Simulator
- VectorVest Variator
- VectorVest Watchdog
