HOT TOPICS LIST
- MACD
- Fibonacci
- RSI
- Gann
- ADXR
- Stochastics
- Volume
- Triangles
- Futures
- Cycles
- Volatility
- ZIGZAG
- MESA
- Retracement
- Aroon
INDICATORS LIST
LIST OF TOPICS
PRINT THIS ARTICLE
by Donald W. Pendergast, Jr.
Shares of IAMGold Corp. are attempting to hammer out a double-bottom pattern against a heavy tide of selling pressure.
Position: N/A
Donald W. Pendergast, Jr.
Freelance financial markets writer and online publisher of the Trendzetterz.com S&P 500 Weekly Forecast service.
PRINT THIS ARTICLE
REL. STR COMPARATIVE
IAG Weakest Relative Strength Among Gold Miners
02/21/13 08:12:58 AMby Donald W. Pendergast, Jr.
Shares of IAMGold Corp. are attempting to hammer out a double-bottom pattern against a heavy tide of selling pressure.
Position: N/A
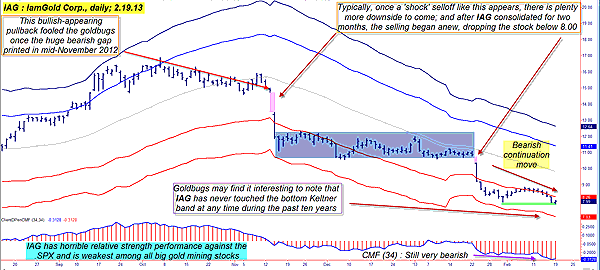
| Like many other liquid, freely traded gold mining stocks, shares of IAMGold Corp. (IAG) enjoyed a very healthy summertime rally last year. From the July 24th low to its October 5th high, IAG's price surged by more than 68%, very nearly touching its extreme upper Keltner band in the process. The runup was so strong that it's doubtful that any technician or market analyst would have been able to foresee that the stock would then proceed to plummet by nearly 54% by February 19, 2013, even taking out its major July 2012 low in the process. However, skilled chartists (like you are becoming, as you read Traders.com Advantage content every day) had advance warning that IAG's heavy decline was very likely to unfold in two distinct waves of selling pressure, thus giving themselves a potentially powerful market edge. Here's a closer look at how that played out as well as a look at what IAG is doing right now (Figures 1 and 2). |

|
| FIGURE 1: IAG, DAILY. Typically, a wide-range bearish gap that is followed by one or more wide-range bearish price bars is as good a confirmation as any that a bearish trend reversal has begun and that there will be at least one more violent thrust lower in the weeks or months ahead. |
| Graphic provided by: TradeStation. |
| |
| When dozens of heavily traded gold mining stocks peaked in early October 2012, it wasn't surprising to see proportional corrective moves ensue, but when the pullbacks instead morphed into full-blown bearish trend reversals, it turned out that the widely followed practice of buying the dips could as easily have been retagged with the moniker "dips doing the buying." For example, in IAG's case, its five-week long consolidation/pullback really did begin to look like the foundation for a rally continuation attempt -- until the morning of November 14, 2012. That's when a huge bearish gap printed (Figure 1, pink shaded area) and wiped out the bulls hopes for another chance of a near-term rise in the stock. And it's also the time when savvy technicians were clued in that IAG's next major swing/trend move was probably going to be toward much lower levels, after a period of consolidation and back-and-fill-action. When you see these shocking, wide-range bearish gaps occur, chances are it's not the buying opportunity you're waiting for but rather the start of a multiweek (month) sustained decline, one that will almost certainly have a subsequent bearish plunge prior to a final washout into tradable lows. That's just what happened in the case of IAG, and now that we've already seen perhaps the worst part of the second shock-wave to even lower levels, now might be a good time to size up the chart and see if there are any clues that a major low may actually be forming. |

|
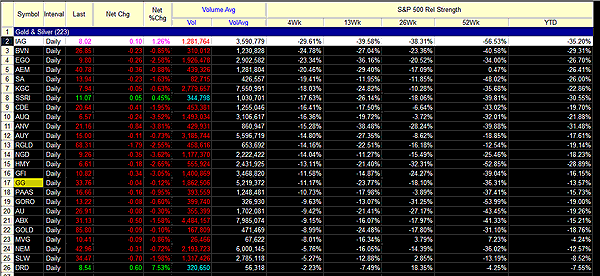
| FIGURE 2: RELATIVE STRENGTH. Among high-volume gold mining stocks, IAG has the absolute worst relative strength rankings against the .SPX as compared to its peers. |
| Graphic provided by: TradeStation. |
| Graphic provided by: TradeStation Radar Screen. |
| |
| Money flow in IAG is still extremely poor, with no sign yet of a bullish divergence with price action. However, IAG's current attempt at making a small-scale double-bottom pattern looks rather hopeful, especially since its daily trading volumes have been falling for most of the last month. Price action is what defines a confirmed reversal, though, and until IAG makes a daily close above its closest Keltner band (red), bulls would be well advised to wait for the reversal to become evident, only going long once the confirming price bar's high is exceeded. Once such a daily price bar appears, aggressive bulls may very well want to consider selling a March '13 $8.00 put; the bid-ask spread is tolerable and the open interest figures are close to 1,400 contracts. Daily time decay works out to $1 per day per contract, another nice feature that works in an option seller's favor. See Figure 2. As always, risk control is of prime importance in this or any other trade. Since this is a high-risk trade, a maximum of 1% should be risked, with the trade closed out if the option declines in value by 50% or if it increases in value by 80%. Traders can also choose to buy IAG shares instead of selling a put, and in fact is a less risky way to play IAG on a reversal attempt. Trade wisely until we meet here again, as always. |
Freelance financial markets writer and online publisher of the Trendzetterz.com S&P 500 Weekly Forecast service.
| Title: | Market consultant and writer |
| Company: | Trendzetterz |
| Address: | 81 Hickory Hollow Drive |
| Crossville, TN 38555 | |
| Phone # for sales: | 904-303-4814 |
| Website: | trendzetterz.com |
| E-mail address: | support@trendzetterz.com |
Traders' Resource Links | |
| Trendzetterz has not added any product or service information to TRADERS' RESOURCE. | |
Click here for more information about our publications!
Comments

Request Information From Our Sponsors
- StockCharts.com, Inc.
- Candle Patterns
- Candlestick Charting Explained
- Intermarket Technical Analysis
- John Murphy on Chart Analysis
- John Murphy's Chart Pattern Recognition
- John Murphy's Market Message
- MurphyExplainsMarketAnalysis-Intermarket Analysis
- MurphyExplainsMarketAnalysis-Visual Analysis
- StockCharts.com
- Technical Analysis of the Financial Markets
- The Visual Investor
- VectorVest, Inc.
- Executive Premier Workshop
- One-Day Options Course
- OptionsPro
- Retirement Income Workshop
- Sure-Fire Trading Systems (VectorVest, Inc.)
- Trading as a Business Workshop
- VectorVest 7 EOD
- VectorVest 7 RealTime/IntraDay
- VectorVest AutoTester
- VectorVest Educational Services
- VectorVest OnLine
- VectorVest Options Analyzer
- VectorVest ProGraphics v6.0
- VectorVest ProTrader 7
- VectorVest RealTime Derby Tool
- VectorVest Simulator
- VectorVest Variator
- VectorVest Watchdog
