HOT TOPICS LIST
- MACD
- Fibonacci
- RSI
- Gann
- ADXR
- Stochastics
- Volume
- Triangles
- Futures
- Cycles
- Volatility
- ZIGZAG
- MESA
- Retracement
- Aroon
INDICATORS LIST
LIST OF TOPICS
PRINT THIS ARTICLE
by Billy Williams
Visa almost emerged as a stock leader but stumbled. Now, is it about to lead the market higher?
Position: Hold
Billy Williams
Billy Williams has been trading the markets for 27 years, specializing in momentum trading with stocks and options.
PRINT THIS ARTICLE
STOCKS
Visa's Buy Points And Future
02/21/13 07:59:38 AMby Billy Williams
Visa almost emerged as a stock leader but stumbled. Now, is it about to lead the market higher?
Position: Hold
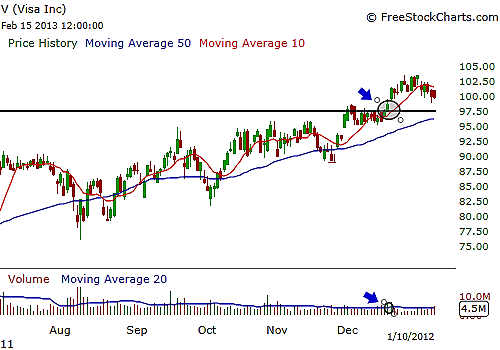
| In April 2010, Visa (V) was trading at an all-time high and at the height of its power, with many analysts and speculators expecting the finance powerhouse to emerge as a new stock leader, but fate had different plans. The market turned on Visa, handing control to the bears, who took the stock down on a steep decline, which has taken just under two years to repair the technical damage. The stock correction hovered between 25% to 30% from its high of just over $97 to a low of $64.90. Off its price low, Visa found support and started building a base from there to try to gain a foothold in the market and trade higher. It was a painful process but in early December 2011, its price action traded up through resistance and broke higher. See Figure 1. Visa has been on a strong run and is now in a position to attempt to emerge as a stock leader again, but the question is whether it can continue on this path, or will the bears knock it off its perch once more. |

|
| FIGURE 1: V. On December 19, 2011, a pocket pivot entry was signaled as Visa traded near its resistance point, revealing that the bulls were seizing control of price and taking it higher. |
| Graphic provided by: www.freestockcharts.com. |
| |
| To gain a better understanding of how Visa arrived at its current tipping point, a close study of its past may offer more insight into its current state to help determine whether this is a potential stock leader or tomorrow's roadkill. |

|
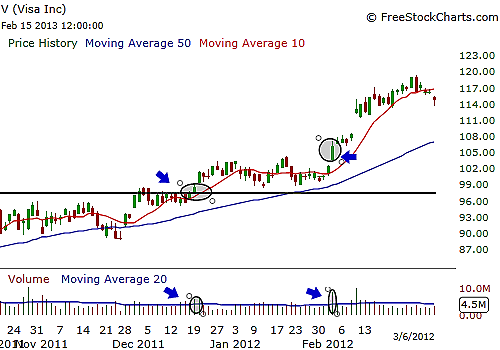
| FIGURE 2: V. On February 2, 2012, a buyable gap-up formed, which revealed that it was a continuation move and the opportunity to scale into another position if you chose to. |
| Graphic provided by: www.freestockcharts.com. |
| |
| Visa has been around for decades and grabs a piece of the action from every swipe of a debit or credit card, giving it limitless earning potential in addition to incredible branding to consumers and businesses. Its initial public offering (IPO) was highly anticipated but, unfortunately, its timing could not have been worse. Visa went public in March 2008, just as the mortgage subprime meltdown was sending off tremors throughout the market that eventually developed into a full-fledged earthquake that took down the markets worldwide. |

|
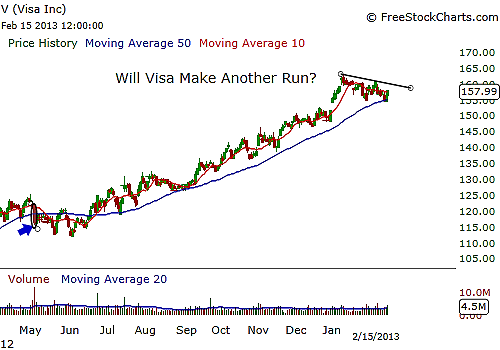
| FIGURE 3: V. Over the next several months, price flirted with violating the 10-day SMA but nothing was confirmed. The seven-weeks rule kicked in when price maintained its level above the 10-day SMA for seven weeks with no confirmed violation, which meant that if the 10-day SMA was violated at any point after that time period, an exit would be signaled, which it was on May 3, 2012. Conservatively, a respectable 15% return, give or take, was produced during just over four months. |
| Graphic provided by: www.freestockcharts.com. |
| |
| However, despite the bad timing, and the price decline, Visa remained surprisingly hardy and showed strength by maintaining its price as close as possible to the $97 level. If price had declined by more than 50% like many stocks, you might not be reading about Visa in this article at all since many stocks never fully recover from such a decline in a bear market or, at least, take a lot longer to repair the technical damage. Visa has rallied by greater than 50% since its December 2011 breakout and has offered several buy points to alert traders using a combination of pocket pivot buy points and buyable gap-ups (Figure 2). Visa's price action was tailor made for momentum traders and breakout traders alike, as the explosive price action has accelerated since its breakout move from the $97 area on greater volume while managing to avoid any violation of the 10-day simple moving average (SMA) (Figure 3) and 50-day SMA, revealing strength as the stock climbs higher. Now, can Visa maintain its run? |

|
| FIGURE 4: V. Visa went on to signal new entry points as it ascended to just under $163 before pulling back and forming a bullish flag pattern. The 50-day SMA seems to be showing support and if Visa breaks out higher on heavy volume, it could lead the market higher and possibly past the SPX all-time high of 1575. |
| Graphic provided by: www.freestockcharts.com. |
| |
| Currently, Visa is forming a flag pattern, a bullish sign, as the market inches higher each day as traders anticipate a run on the 1575 level, the SPX's all-time high, which is within striking distance (see Figure 4). That said, all signs point upward for the market and as Visa trades near its all-time high with no resistance ahead and all its technical damage behind it, it looks like a strong candidate for bulls who hope to ride its next leg up and take the rest of the market with it. Look for strong price action as Visa trades through the upper trendline of its flag pattern and on higher volume where the buying volume is higher than any of the down volume in the past 10 days or a gap-up with volume the same way. |
Billy Williams has been trading the markets for 27 years, specializing in momentum trading with stocks and options.
| Company: | StockOptionSystem.com |
| E-mail address: | stockoptionsystem.com@gmail.com |
Traders' Resource Links | |
| StockOptionSystem.com has not added any product or service information to TRADERS' RESOURCE. | |
Click here for more information about our publications!
PRINT THIS ARTICLE

Request Information From Our Sponsors
- VectorVest, Inc.
- Executive Premier Workshop
- One-Day Options Course
- OptionsPro
- Retirement Income Workshop
- Sure-Fire Trading Systems (VectorVest, Inc.)
- Trading as a Business Workshop
- VectorVest 7 EOD
- VectorVest 7 RealTime/IntraDay
- VectorVest AutoTester
- VectorVest Educational Services
- VectorVest OnLine
- VectorVest Options Analyzer
- VectorVest ProGraphics v6.0
- VectorVest ProTrader 7
- VectorVest RealTime Derby Tool
- VectorVest Simulator
- VectorVest Variator
- VectorVest Watchdog
- StockCharts.com, Inc.
- Candle Patterns
- Candlestick Charting Explained
- Intermarket Technical Analysis
- John Murphy on Chart Analysis
- John Murphy's Chart Pattern Recognition
- John Murphy's Market Message
- MurphyExplainsMarketAnalysis-Intermarket Analysis
- MurphyExplainsMarketAnalysis-Visual Analysis
- StockCharts.com
- Technical Analysis of the Financial Markets
- The Visual Investor
