HOT TOPICS LIST
- MACD
- Fibonacci
- RSI
- Gann
- ADXR
- Stochastics
- Volume
- Triangles
- Futures
- Cycles
- Volatility
- ZIGZAG
- MESA
- Retracement
- Aroon
INDICATORS LIST
LIST OF TOPICS
PRINT THIS ARTICLE
by Gary Grosschadl
Even though Canada's oil and gas giant beat recent estimates, the chart doesn't lie - it is looking bearish.
Position: N/A
Gary Grosschadl
Independent Canadian equities trader and technical analyst based in Peterborough
Ontario, Canada.
PRINT THIS ARTICLE
HEAD & SHOULDERS
Imperial Oil Dethroned?
08/05/02 10:20:25 AMby Gary Grosschadl
Even though Canada's oil and gas giant beat recent estimates, the chart doesn't lie - it is looking bearish.
Position: N/A
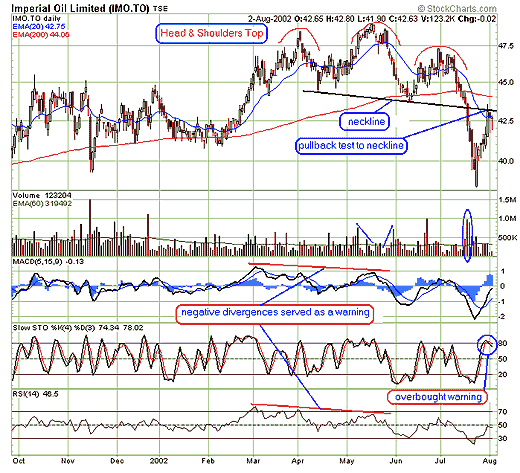
| The chart for Imperial Oil (IMO.TO) shows a head and shoulders topping formation. It's not the prettiest formation being a little erratic and having a slanted neckline, but ironically the 20-day EMA line shows the head and shoulder outline more clearly. Anyone trading that outline would have got an earlier start shorting (or bailing out of a long position) using it. Declining volume at the peak of the head followed by increasing volume as the head declines is correct. Volume surge at the neckline failure along the right shoulder also fits proper volume structure for this pattern. |
| Note the negative divergences shown on the displayed indicators, MACD and RSI. As the stock made new highs, these indicators did not, which served as a warning that the rise was problematic, possibly prone to decline. |

|
| Graphic provided by: stockcharts.com. |
| |
| The beauty of these head and shoulder formations is that you get two chances to short, which is especially nice if you miss the initial decline. This chart is showing a classic pullback to neckline test. Often this pullback fails and the stock resumes its downtrend, giving the shorter additional downside opportunity. |
| There are several indications that this pullback test is already failing. 1. The candle pattern has a hanging man and doji combination hinting at a top. 2. Stock looks to be stalled at 20-day EMA resistance 42.75. 3. Short term stochastics are already turning down from overbought levels. |
| Aggressive traders should be comfortable going short here with a view of testing $40 again, and probably lower. As long as the stock remains under the dual weight of 20- and 200-day EMAs, it looks weak and prone to bear rallies at best. But a surprise move above the neckline and the 200-day EMA resistance negates this bearish view and would be the risk to any shorters. |
Independent Canadian equities trader and technical analyst based in Peterborough
Ontario, Canada.
| Website: | www.whatsonsale.ca/financial.html |
| E-mail address: | gwg7@sympatico.ca |
Click here for more information about our publications!
PRINT THIS ARTICLE

Request Information From Our Sponsors
- StockCharts.com, Inc.
- Candle Patterns
- Candlestick Charting Explained
- Intermarket Technical Analysis
- John Murphy on Chart Analysis
- John Murphy's Chart Pattern Recognition
- John Murphy's Market Message
- MurphyExplainsMarketAnalysis-Intermarket Analysis
- MurphyExplainsMarketAnalysis-Visual Analysis
- StockCharts.com
- Technical Analysis of the Financial Markets
- The Visual Investor
- VectorVest, Inc.
- Executive Premier Workshop
- One-Day Options Course
- OptionsPro
- Retirement Income Workshop
- Sure-Fire Trading Systems (VectorVest, Inc.)
- Trading as a Business Workshop
- VectorVest 7 EOD
- VectorVest 7 RealTime/IntraDay
- VectorVest AutoTester
- VectorVest Educational Services
- VectorVest OnLine
- VectorVest Options Analyzer
- VectorVest ProGraphics v6.0
- VectorVest ProTrader 7
- VectorVest RealTime Derby Tool
- VectorVest Simulator
- VectorVest Variator
- VectorVest Watchdog
