HOT TOPICS LIST
- MACD
- Fibonacci
- RSI
- Gann
- ADXR
- Stochastics
- Volume
- Triangles
- Futures
- Cycles
- Volatility
- ZIGZAG
- MESA
- Retracement
- Aroon
INDICATORS LIST
LIST OF TOPICS
PRINT THIS ARTICLE
by Koos van der Merwe
The housing market is slowly recovering. Is it time to look at companies that produce wood needed in the building of houses?
Position: Accumulate
Koos van der Merwe
Has been a technical analyst since 1969, and has worked as a futures and options trader with First Financial Futures in Johannesburg, South Africa.
PRINT THIS ARTICLE
ELLIOTT WAVE
Looking At Canfor
02/20/13 09:46:34 AMby Koos van der Merwe
The housing market is slowly recovering. Is it time to look at companies that produce wood needed in the building of houses?
Position: Accumulate
| Canfor Corp. (CFP-T) is an integrated forest products company producing softwood lumber, plywood, strand board, and other specialized wood products used in house building. The company also owns a 50.2% interest in Canfor Pulp Holding, which produces softwood kraft pulp and kraft paper. |

|
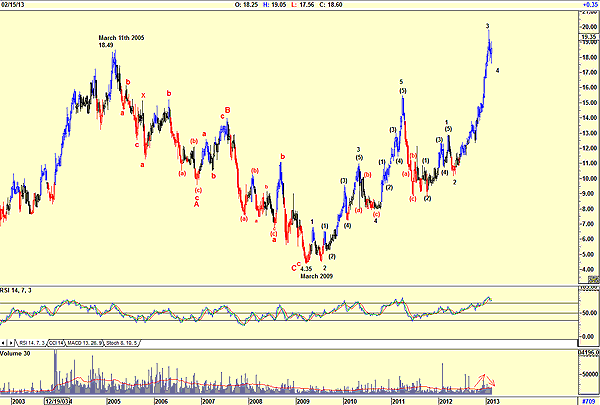
| FIGURE 1: CFP, WEEKLY |
| Graphic provided by: AdvancedGET. |
| |
| Figure 1 is a weekly chart with an Elliott wave count suggesting that wave 4 correction is in process. The relative strength index (RSI) is at overbought levels but has not yet given a sell signal, even though a move of the RSI below its moving average (five-period) is suggesting that a sell signal is on the cards. Previous sell signals by the RSI has proved effective. As you can see on the chart, volume rose as the price rose, a sign of strength, and fell as the price corrected, another sign of strength. Should we buy at present levels? To answer that question, we should look at the daily chart. |

|
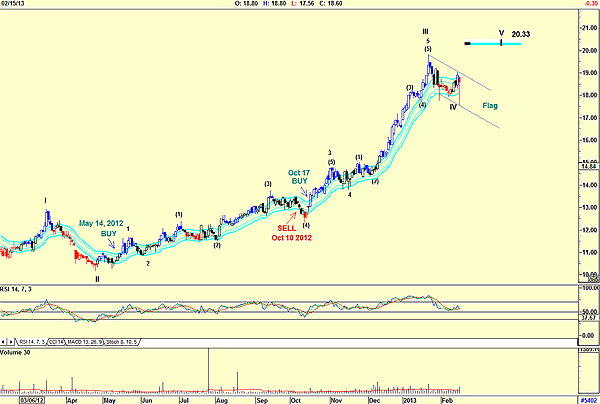
| FIGURE 2: CFP, DAILY. This chart of Canfor Corp. suggests a possible buy in the near future. |
| Graphic provided by: AdvancedGET. |
| |
| The Elliott wave count of a daily chart (Figure 2) suggests that a wave IV is in the process with a wave V to a suggested high of $20.33. The RSI is moving sideways above the 50 level, suggesting that some downside could exist. The price has tested the lower band of the JM internal band indicator, twice, but has not triggered a sell signal; although the low on February 15 did break below the lower band, the closing price did not. Volume on that date was above average, suggesting weakness is on the cards for the short term. CFP is a share I would start buying when the price once again tests or breaks below the lower JM internal band line. The flag pattern that appears to be forming with the wave 4 correction is a very positive pattern. Wave II appears to be a simple correction. Wave IV could then be a complicated correction, so we could see further downside as suggested on the chart. This is a share we should watch. |
Has been a technical analyst since 1969, and has worked as a futures and options trader with First Financial Futures in Johannesburg, South Africa.
| Address: | 3256 West 24th Ave |
| Vancouver, BC | |
| Phone # for sales: | 6042634214 |
| E-mail address: | petroosp@gmail.com |
Click here for more information about our publications!
PRINT THIS ARTICLE

Request Information From Our Sponsors
- StockCharts.com, Inc.
- Candle Patterns
- Candlestick Charting Explained
- Intermarket Technical Analysis
- John Murphy on Chart Analysis
- John Murphy's Chart Pattern Recognition
- John Murphy's Market Message
- MurphyExplainsMarketAnalysis-Intermarket Analysis
- MurphyExplainsMarketAnalysis-Visual Analysis
- StockCharts.com
- Technical Analysis of the Financial Markets
- The Visual Investor
- VectorVest, Inc.
- Executive Premier Workshop
- One-Day Options Course
- OptionsPro
- Retirement Income Workshop
- Sure-Fire Trading Systems (VectorVest, Inc.)
- Trading as a Business Workshop
- VectorVest 7 EOD
- VectorVest 7 RealTime/IntraDay
- VectorVest AutoTester
- VectorVest Educational Services
- VectorVest OnLine
- VectorVest Options Analyzer
- VectorVest ProGraphics v6.0
- VectorVest ProTrader 7
- VectorVest RealTime Derby Tool
- VectorVest Simulator
- VectorVest Variator
- VectorVest Watchdog
