HOT TOPICS LIST
- MACD
- Fibonacci
- RSI
- Gann
- ADXR
- Stochastics
- Volume
- Triangles
- Futures
- Cycles
- Volatility
- ZIGZAG
- MESA
- Retracement
- Aroon
INDICATORS LIST
LIST OF TOPICS
PRINT THIS ARTICLE
by Koos van der Merwe
Bill Ackman has shorted Herbalife, and Carl Icahn bought Herbalife? What should you do?
Position: N/A
Koos van der Merwe
Has been a technical analyst since 1969, and has worked as a futures and options trader with First Financial Futures in Johannesburg, South Africa.
PRINT THIS ARTICLE
ELLIOTT WAVE
When In Doubt, Stay Out? About Herbalife
02/19/13 08:48:43 AMby Koos van der Merwe
Bill Ackman has shorted Herbalife, and Carl Icahn bought Herbalife? What should you do?
Position: N/A
| The debate and argument between Bill Ackman and Carl Icahn on CNBC surprised everyone. The two billionaires have been in a feud for years. Of course, investors are now asking if Bill Ackman is correct in stating that Herbalife is a pyramid scheme, or if Carl Icahn is correct in stating that Herbalife is a solid money-making company, which is why he bought shares. Who is correct? What do the charts tell us? |

|
| FIGURE 1: HLF, MONTHLY |
| Graphic provided by: AdvancedGET. |
| |
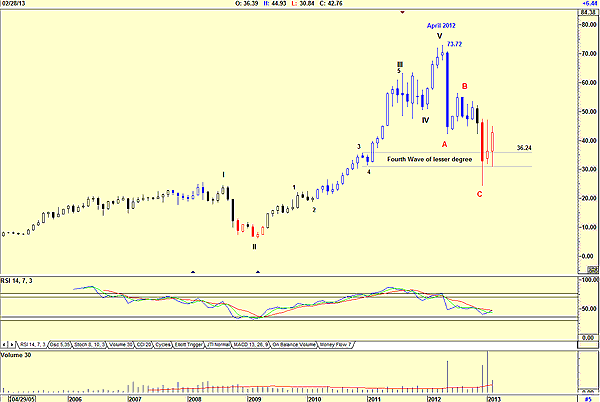
| Figure 1 is a monthly chart and shows an Elliott wave count suggesting that the company is in an ABC correction. Did the correction start when Ackman took his short position? He disclosed in December 2012 that he held a short position in Herbalife, so the possibility that he took the short position in April 2012 or soon after is very possible. Note the sudden collapse of the share price from $73.72 to $42.35 in May 2012. The correction in a wave B to $56.15 is on lower volume, a sign of further weakness ahead, and the share price fell further from $56.15 in July 2012 to a low of $24.48 by December 2012. The share price rose, making a high of $47.35 on strong volume, but then continued rising on weaker volume, a sign of weakness. The relative strength index (RSI) is still trending down and is not yet at oversold levels. Does this mean that Icahn is wrong, and that we can expect further weakness? |

|
| FIGURE 2: HLF, WEEKLY |
| Graphic provided by: AdvancedGET. |
| |
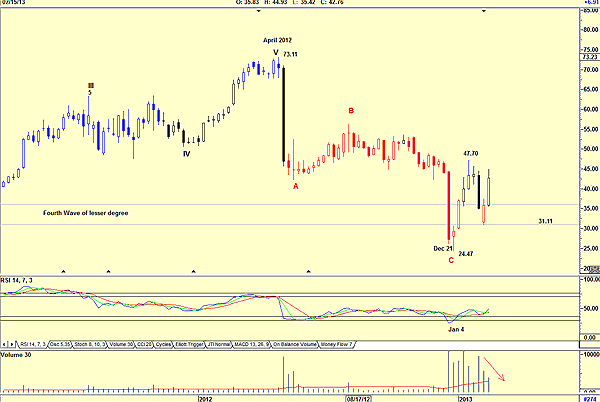
| Figure 2 is a weekly chart and shows that wave C actually fell below the fourth wave of lesser degree to $24.47. Volume shows weakness as the price dropped, a sign of strength, but further weakness continued as the price rose. This suggests uncertainty. The RSI has given a buy signal on January 4, possibly a reason why Icahn started looking at the share as a possible buy. Why the buy? Ackman disclosed in December that he had a short position. That could have been the reason for the drop in price during the week ended December 21. Did the market believe the share was oversold? Icahn bought options, not shares, and only made his announcement on Friday, December 15. |

|
| FIGURE 3: HLF, DAILY |
| Graphic provided by: AdvancedGET. |
| |
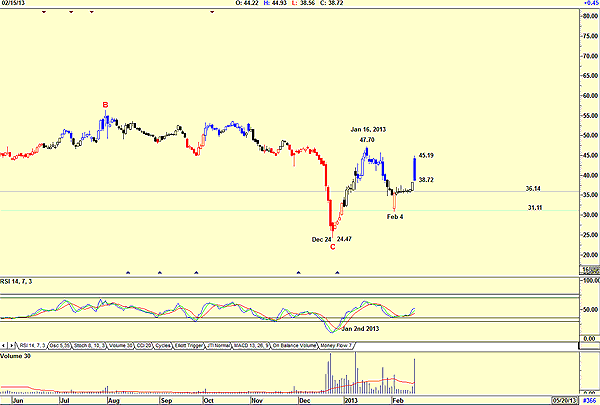
| Figure 3 is a daily chart and shows how the share price rose from a low of $24.47 on December 24 to a high of $47.70 by January 16, 2013. This was after Ackman had disclosed that he owned a short position. Price fell to $31.11 by February 4 then rose to $36.14, where it traded sideways until the day before Icahn's announcement, when it rose to $45.19 before closing at $38.72. Volume was strong with the rise in price, but with the price reaching a high of $45.19 and then falling to close at $38.72, this tells us nothing. The RSI, however, is trending up. One concern with the chart is that wave C at $24.47 was below the fourth wave of lesser degree low of $31.11. Warren Buffett, one of the best-known and cautious investors in the world today, has always said, "When in doubt, stay out." My daily chart is showing a degree of confusion, with one asking, is Carl Icahn's option trade an attempt to create a short squeeze and so harm Bill Ackman's short position? The other question is, does Bill Ackman look at charts? If so, he would have seen that he should have covered his short position when he told the world about it in December 2102. Perhaps he did, but I doubt it. Carl Icahn would have surely seen that, but who knows for sure. |
Has been a technical analyst since 1969, and has worked as a futures and options trader with First Financial Futures in Johannesburg, South Africa.
| Address: | 3256 West 24th Ave |
| Vancouver, BC | |
| Phone # for sales: | 6042634214 |
| E-mail address: | petroosp@gmail.com |
Click here for more information about our publications!
PRINT THIS ARTICLE

Request Information From Our Sponsors
- StockCharts.com, Inc.
- Candle Patterns
- Candlestick Charting Explained
- Intermarket Technical Analysis
- John Murphy on Chart Analysis
- John Murphy's Chart Pattern Recognition
- John Murphy's Market Message
- MurphyExplainsMarketAnalysis-Intermarket Analysis
- MurphyExplainsMarketAnalysis-Visual Analysis
- StockCharts.com
- Technical Analysis of the Financial Markets
- The Visual Investor
- VectorVest, Inc.
- Executive Premier Workshop
- One-Day Options Course
- OptionsPro
- Retirement Income Workshop
- Sure-Fire Trading Systems (VectorVest, Inc.)
- Trading as a Business Workshop
- VectorVest 7 EOD
- VectorVest 7 RealTime/IntraDay
- VectorVest AutoTester
- VectorVest Educational Services
- VectorVest OnLine
- VectorVest Options Analyzer
- VectorVest ProGraphics v6.0
- VectorVest ProTrader 7
- VectorVest RealTime Derby Tool
- VectorVest Simulator
- VectorVest Variator
- VectorVest Watchdog
