HOT TOPICS LIST
- MACD
- Fibonacci
- RSI
- Gann
- ADXR
- Stochastics
- Volume
- Triangles
- Futures
- Cycles
- Volatility
- ZIGZAG
- MESA
- Retracement
- Aroon
INDICATORS LIST
LIST OF TOPICS
PRINT THIS ARTICLE
by Donald W. Pendergast, Jr.
After three weeks of range-bound price action, shares of Halliburton have just made a decisively bullish breakout.
Position: N/A
Donald W. Pendergast, Jr.
Freelance financial markets writer and online publisher of the Trendzetterz.com S&P 500 Weekly Forecast service.
PRINT THIS ARTICLE
CYCLES
Halliburton Breaks To New 52-Week High
02/15/13 09:59:37 AMby Donald W. Pendergast, Jr.
After three weeks of range-bound price action, shares of Halliburton have just made a decisively bullish breakout.
Position: N/A
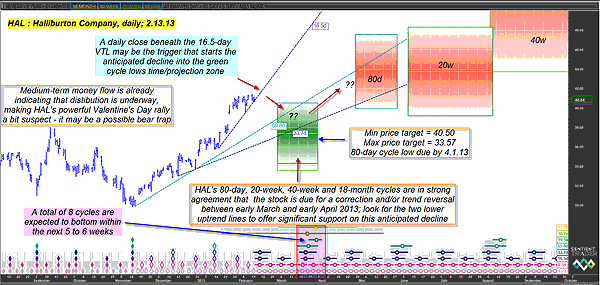
| Halliburton (HAL) stock, like many other large-cap oil services issues, frequently makes powerful breakouts that result in tradable moves several times each year, and if a trader can manage to stay on the right side of this particularly energetic market, the odds of making a profit are usually quite good. With a powerful bullish breakout under way in HAL, the stock has made yet another 52-week high and it is now trading at 42.56 -- up nearly two dollars from the prior day's closing price. But just how do you determine which is the correct side of a given market like HAL, anyway? Does this latest rally have good odds for a sustained rally, or is a correction due? Here's closer look now at HAL's informative daily cycles chart for some answers (Figures 1 and 2). |

|
| FIGURE 1: HAL, DAILY. Calling the top in a strongly trending stock is foolish, but once HAL closes below its uppermost trendline, the odds of a steady decline toward (or even into) the green cycle low time/price projection zone are very high. |
| Graphic provided by: Sentient Trader. |
| |
| After experiencing a sharp, two-stage selloff between mid-September 2012 and mid-November 2012, HAL dropped by nearly 22% before forming a major multicycle low, one where no less than six price cycles ranging from four days to 20 weeks in length bottomed en masse. The resulting rally out of that November 14, 2012, hole has been impressive; despite several attempted shakeouts (and resulting corrections) by the bulls, the stock is now trading at a value nearly 43% higher than it was only three months ago. Its powerful Valentine's Day bullish breakout to fresh 52-week highs appears to -- at first glance -- be the initial phase in yet another rally attempt to $43.00 and beyond. However, careful study of four of HAL's longer-term cycles reveals that this energy sector player's three-month-old rally is much closer to the end of its run than it is to its beginning. Just look at the acceleration of the most recent uptrend line (the 16.5-day valid trendline [VTL]) in relation to the lower uptrend lines. This stock is beginning to go parabolic -- even as its 34-day Chaikin money flow histogram (not shown) suggests that at least some of the smart money traders have been selling into HAL's most recent rally phase (since early January 2013). Now, it's foolish to attempt to pick a top in a strongly trending stock (it's a risky game most of the time), but by looking at where HAL's 80-day and 20/40-week cycles and its 18-month cycle all agree that a major swing low is expected to form (green box on Figure 1), we can understand that after HAL finally does peak, a major, high-probability correction is almost certain to follow. |

|
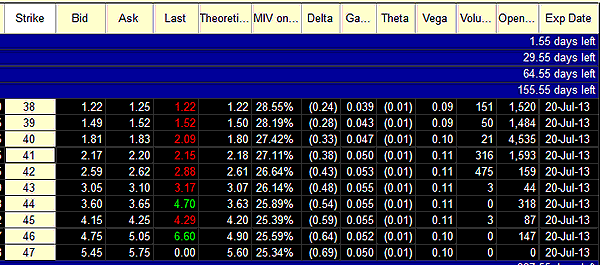
| FIGURE 2: HAL. Halliburton's July '13 put options at the $38 to $41 strike prices generally have close bid/ask spreads and decent open interest and daily trading volumes. |
| Graphic provided by: TradeStation. |
| Graphic provided by: TradeStation. |
| |
| One of the first tipoffs that HAL has or will soon peak will be when you see the stock make a daily close below its 16.5-day VTL; once you see that price bar in place, that's when speculative bears can consider buying at-the-money puts with at least three to four months time value, using the next lower trendline (the 69.8-day VTL on chart) as the initial profit target. The VTL intersects with the top portion of the multicycle low time/price projection zone and would be a terrific place to take partial profits and/or completely sell out of such a long put position and should prove to be very profitable if the anticipated selloff gathers steam quickly. As with most long put/call plays, if the option loses 50% of its value or rises by 85% to 100% (if it hasn't hit the profit target by then), sell it and go back to the safety of cash. In this case, you'll also want to make sure HAL doesn't rise back above the swing high prior to such an anticipated decline below the 16.9-day VTL; if it does, just sell the put, even if it hasn't lost 50% of its value. While HAL's anticipated decline into March-April 2013 is a high-probability event, by no means risk more than 2% of your account value on this or any other stock or option play. Trade wisely until we meet here again. |
Freelance financial markets writer and online publisher of the Trendzetterz.com S&P 500 Weekly Forecast service.
| Title: | Market consultant and writer |
| Company: | Trendzetterz |
| Address: | 81 Hickory Hollow Drive |
| Crossville, TN 38555 | |
| Phone # for sales: | 904-303-4814 |
| Website: | trendzetterz.com |
| E-mail address: | support@trendzetterz.com |
Traders' Resource Links | |
| Trendzetterz has not added any product or service information to TRADERS' RESOURCE. | |
Click here for more information about our publications!
PRINT THIS ARTICLE

|

Request Information From Our Sponsors
- StockCharts.com, Inc.
- Candle Patterns
- Candlestick Charting Explained
- Intermarket Technical Analysis
- John Murphy on Chart Analysis
- John Murphy's Chart Pattern Recognition
- John Murphy's Market Message
- MurphyExplainsMarketAnalysis-Intermarket Analysis
- MurphyExplainsMarketAnalysis-Visual Analysis
- StockCharts.com
- Technical Analysis of the Financial Markets
- The Visual Investor
- VectorVest, Inc.
- Executive Premier Workshop
- One-Day Options Course
- OptionsPro
- Retirement Income Workshop
- Sure-Fire Trading Systems (VectorVest, Inc.)
- Trading as a Business Workshop
- VectorVest 7 EOD
- VectorVest 7 RealTime/IntraDay
- VectorVest AutoTester
- VectorVest Educational Services
- VectorVest OnLine
- VectorVest Options Analyzer
- VectorVest ProGraphics v6.0
- VectorVest ProTrader 7
- VectorVest RealTime Derby Tool
- VectorVest Simulator
- VectorVest Variator
- VectorVest Watchdog
