HOT TOPICS LIST
- MACD
- Fibonacci
- RSI
- Gann
- ADXR
- Stochastics
- Volume
- Triangles
- Futures
- Cycles
- Volatility
- ZIGZAG
- MESA
- Retracement
- Aroon
INDICATORS LIST
LIST OF TOPICS
PRINT THIS ARTICLE
by Koos van der Merwe
Some indicators are looking overbought. Do you buy now when you receive a buy signal, or do you wait?
Position: Sell
Koos van der Merwe
Has been a technical analyst since 1969, and has worked as a futures and options trader with First Financial Futures in Johannesburg, South Africa.
PRINT THIS ARTICLE
CYCLES
Do You Buy Now?
02/15/13 09:37:47 AMby Koos van der Merwe
Some indicators are looking overbought. Do you buy now when you receive a buy signal, or do you wait?
Position: Sell
| We all know that the way the first five days of January forecast the yearly market trend, and this year, those first five days were positive. We also know that the old saying "Sell in May and go away" is one that has proved to be very successful over the years. With indexes at the moment at overbought levels and cyclical charts suggesting that a correction could occur, do you buy as the market falls? The answer is a decided "Yes." |

|
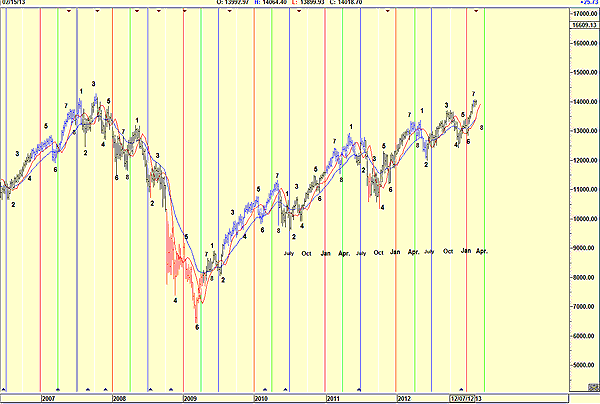
| FIGURE 1: PAGET WEEKLY CYCLE |
| Graphic provided by: AdvancedGET. |
| |
| In the 1980s I met a man called Paget. He introduced me to a cyclical pattern shown in Figure 1. It is a simple pattern, basically dividing a year into four periods. What he did was repeat a count close to a month as a warning signal, using the logic that a correction, whether small or large, was due. Using his theory, looking at the Dow Jones Industrial Average (DJIA), we can see that the repetitive patterns 7 and 8 that occurs before the April 1st vertical line has been pretty consistent and accurate over past years. In 2009 and 2010, in the bull market, the correction was late, and in 2008, as the DJIA fell, the correction was early. In 2011 and 2012, the pattern was just before or on the vertical green line. Now, will the "7" be topping out now, or closer to April 1? If it is topping out now, then we must wait and see whether the "8" bottoms out before or after April 1. This will give us an indication of the trend ahead. So until the "7" actually does top out, you should be a buyer, but with stops kept close. |

|
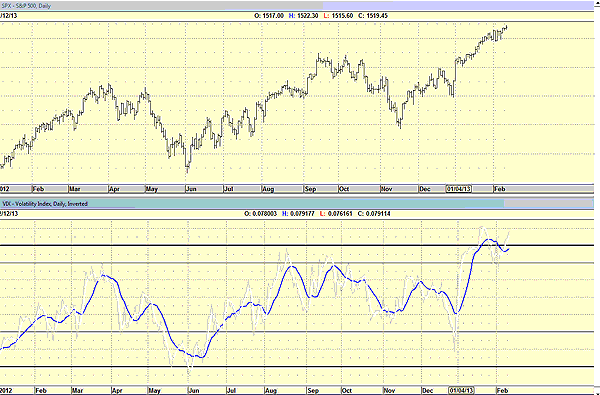
| FIGURE 2: S&P 500 AND INVERTED VIX |
| Graphic provided by: AdvancedGET. |
| |
| Figure 2 shows the Standard & Poor's 500 and the volatility index (VIX) inverted. The VIX is at overbought levels and suggesting a correction is possible. |

|
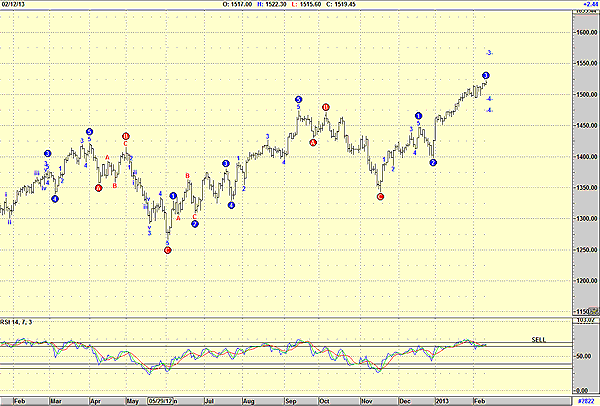
| FIGURE 3: WEEKLY ELLIOTT WAVE CHART OF THE S&P 500 |
| Graphic provided by: AdvancedGET. |
| |
| Figure 3 is a weekly chart of the S&P 500. The Elliott wave count shown is suggesting that a wave 3 is complete, and a wave 4 correction is due. This is confirmed by the relative strength index (RSI), which is overbought and has given a sell signal. I would be a cautious buyer at the moment. I would make a list of shares that I would like to own and buy them as the market falls in the wave 4 correction. Do note that the wave 2 correction was a simple one, so the wave 4 correction should be complicated. With stocks that you own, should you receive a sell signal, take profits, and buy back at lower prices? For stocks that pay you dividends or interest, however, hold until wave 5 is completed. |
Has been a technical analyst since 1969, and has worked as a futures and options trader with First Financial Futures in Johannesburg, South Africa.
| Address: | 3256 West 24th Ave |
| Vancouver, BC | |
| Phone # for sales: | 6042634214 |
| E-mail address: | petroosp@gmail.com |
Click here for more information about our publications!
Comments
Date: 07/18/13Rank: 5Comment:

Request Information From Our Sponsors
- VectorVest, Inc.
- Executive Premier Workshop
- One-Day Options Course
- OptionsPro
- Retirement Income Workshop
- Sure-Fire Trading Systems (VectorVest, Inc.)
- Trading as a Business Workshop
- VectorVest 7 EOD
- VectorVest 7 RealTime/IntraDay
- VectorVest AutoTester
- VectorVest Educational Services
- VectorVest OnLine
- VectorVest Options Analyzer
- VectorVest ProGraphics v6.0
- VectorVest ProTrader 7
- VectorVest RealTime Derby Tool
- VectorVest Simulator
- VectorVest Variator
- VectorVest Watchdog
- StockCharts.com, Inc.
- Candle Patterns
- Candlestick Charting Explained
- Intermarket Technical Analysis
- John Murphy on Chart Analysis
- John Murphy's Chart Pattern Recognition
- John Murphy's Market Message
- MurphyExplainsMarketAnalysis-Intermarket Analysis
- MurphyExplainsMarketAnalysis-Visual Analysis
- StockCharts.com
- Technical Analysis of the Financial Markets
- The Visual Investor
