HOT TOPICS LIST
- MACD
- Fibonacci
- RSI
- Gann
- ADXR
- Stochastics
- Volume
- Triangles
- Futures
- Cycles
- Volatility
- ZIGZAG
- MESA
- Retracement
- Aroon
INDICATORS LIST
LIST OF TOPICS
PRINT THIS ARTICLE
by Chaitali Mohile
Curtiss Wright Corp. is showing signs of trend reversal possibilities while heading towards its previous high.
Position: N/A
Chaitali Mohile
Active trader in the Indian stock markets since 2003 and a full-time writer. Trading is largely based upon technical analysis.
PRINT THIS ARTICLE
CHART ANALYSIS
Bullish Rally Of CW Halts?
02/15/13 09:33:48 AMby Chaitali Mohile
Curtiss Wright Corp. is showing signs of trend reversal possibilities while heading towards its previous high.
Position: N/A
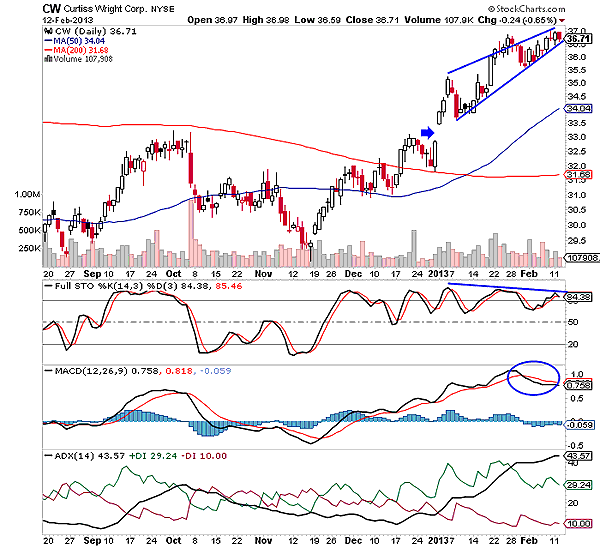
| After establishing strong support at the 200-day moving average (MA), Curtiss Wright Corp. (CW) initiated a bullish rally with a small gap up. Fresh buying pressure encouraged the rally to surge higher. The three large white candles showed bullish strength in the stock. The average directional index (ADX) (14) indicated a new developing uptrend, the full stochastic (14,3,3) rallied in an overbought zone above 50 levels, and the moving average convergence/divergence (MACD) (12,26,9) surged in positive territory above the zero line. These bullish conditions indicated that CW would likely continue the rally with strong momentum. However, the volume decreased as the rally climbed higher and higher. As a result, CW moved in a narrow trading range, forming a rising wedge -- a bearish reversal pattern (Figure 1). The rising wedge formation breaks downward, initiating a fresh declining rally. However, traders have to take additional confirmation from the indicators they use. |

|
| FIGURE 1: CW, DAILY |
| Graphic provided by: StockCharts.com. |
| |
| Here, an overheated ADX (14) is indicating a trend reversal possibility. Although ADX (14) can sustain in an overheated area for a longer period, it definitely affects the price movement by inducing uncertainty among traders and investors. The stochastic oscillator is highlighting negative divergence, and the MACD (12,26,9) has turned negative in positive territory. The indicators are showing reversal signals, thus confirming the rising wedge pattern as the bearish reversal formation. Therefore, CW is likely to undergo a short-term bearish breakout in the next few trading sessions. |
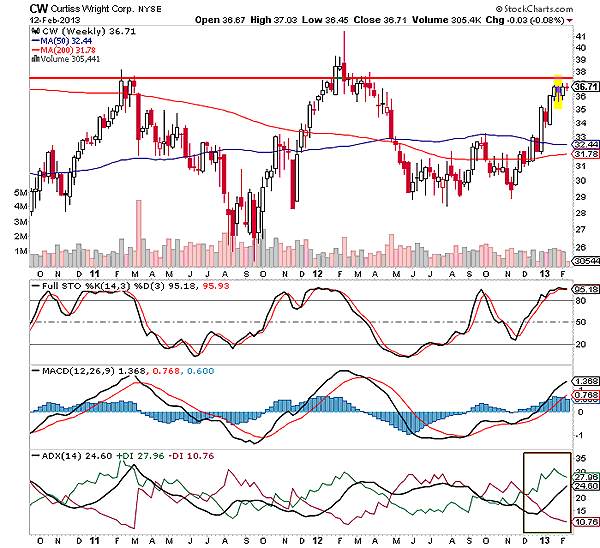
| In Figure 2, CW has formed robust resistance at 37 levels (see the red line). The stock plunged twice from this level. Both corrective rallies breached the 50-day and 200-day MA supports. Although they immediately recovered from the previous loss, the stock was flooded with high volatility. A bullish moving average crossover in early 2012 was the first positive indication on the price chart in Figure 2. This could be one of the reasons for forming a higher low in 2012. |

|
| FIGURE 2: CW, WEEKLY |
| Graphic provided by: StockCharts.com. |
| |
| Currently, CW has once again reached its previous high resistance with the bullish support of a 50-day MA. The highly overbought stochastic at 95 levels is likely to take a nose-dive. The positive MACD (12,26,9) would change its direction and repeat the history. Though an uptrend is developing currently, the ADX (14) hardly sustained above the 30 levels in the past. In addition, CW has formed a hanging man -- a bearish reversal candlestick pattern. This suggests that the stock is likely to correct from the resistance line and form a third peak in Figure 2. A double top is already formed by the price rally as well as the indicators. Therefore, the third top would weaken the stock. |
| However, the fresh descending rally of CW has to establish support at the moving average for the trend to continue. The extremely bullish indicators and the previous high resistance would terminate the existing bullish rally of CW. In the next few trading sessions, CW could begin to descend. |
Active trader in the Indian stock markets since 2003 and a full-time writer. Trading is largely based upon technical analysis.
| Company: | Independent |
| Address: | C1/3 Parth Indraprasth Towers. Vastrapur |
| Ahmedabad, Guj 380015 | |
| E-mail address: | chaitalimohile@yahoo.co.in |
Traders' Resource Links | |
| Independent has not added any product or service information to TRADERS' RESOURCE. | |
Click here for more information about our publications!
Comments

Request Information From Our Sponsors
- StockCharts.com, Inc.
- Candle Patterns
- Candlestick Charting Explained
- Intermarket Technical Analysis
- John Murphy on Chart Analysis
- John Murphy's Chart Pattern Recognition
- John Murphy's Market Message
- MurphyExplainsMarketAnalysis-Intermarket Analysis
- MurphyExplainsMarketAnalysis-Visual Analysis
- StockCharts.com
- Technical Analysis of the Financial Markets
- The Visual Investor
- VectorVest, Inc.
- Executive Premier Workshop
- One-Day Options Course
- OptionsPro
- Retirement Income Workshop
- Sure-Fire Trading Systems (VectorVest, Inc.)
- Trading as a Business Workshop
- VectorVest 7 EOD
- VectorVest 7 RealTime/IntraDay
- VectorVest AutoTester
- VectorVest Educational Services
- VectorVest OnLine
- VectorVest Options Analyzer
- VectorVest ProGraphics v6.0
- VectorVest ProTrader 7
- VectorVest RealTime Derby Tool
- VectorVest Simulator
- VectorVest Variator
- VectorVest Watchdog
