HOT TOPICS LIST
- MACD
- Fibonacci
- RSI
- Gann
- ADXR
- Stochastics
- Volume
- Triangles
- Futures
- Cycles
- Volatility
- ZIGZAG
- MESA
- Retracement
- Aroon
INDICATORS LIST
LIST OF TOPICS
PRINT THIS ARTICLE
by Donald W. Pendergast, Jr.
Shares of Bank of America continue to trend higher, but two key price cycles are warning of a near-term reversal.
Position: N/A
Donald W. Pendergast, Jr.
Freelance financial markets writer and online publisher of the Trendzetterz.com S&P 500 Weekly Forecast service.
PRINT THIS ARTICLE
CYCLES
For Bank Of America, Cycles Warn Of Near-Term High
02/14/13 12:33:55 PMby Donald W. Pendergast, Jr.
Shares of Bank of America continue to trend higher, but two key price cycles are warning of a near-term reversal.
Position: N/A
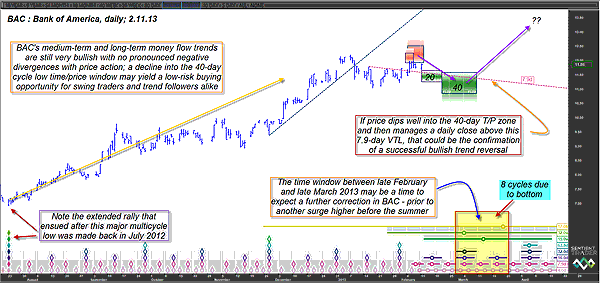
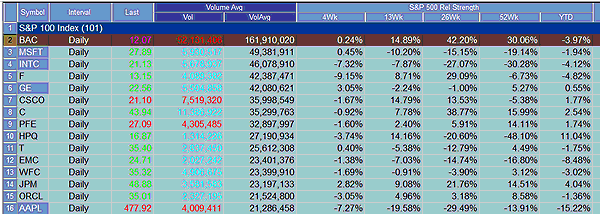
| Up by more than 75% since completing a double-bottom pattern last summer, shares of BAC have been trending exceptionally well for more than six months now, causing this super-high volume (averaging more than 160 million shares per day) financial issue to outpace the performance of the majority of its peers in the Standard & Poor's 100. However, several key technicals are now suggesting that BAC is getting very close to a near-term cycle high -- with a correction due at any time. Here's a closer look now (Figures 1 and 2). |

|
| FIGURE 1: BAC, DAILY. Money flow and price cycle analysis suggests that any decline into the 40-day cycle time/price projection zone may set up a prime buying opportunity in shares of BAC. |
| Graphic provided by: Sentient Trader. |
| |
| BAC's daily cycles chart paints a simple, yet clear image of a strongly trending stock that has begun to lose a bit of upward momentum -- just as its 20- and 40-day price cycles are due to make significant swing highs. In fact, the swing high for both of these key near-term cycles (which are of great potential value to swing traders) may actually have been completed on Thursday, February 7, 2013, with the anticipated decline down into the 20- and/or 40-day cycle low time/price projection (T/P) zones (green boxes) already under way. An interesting dynamic of BAC's daily chart is that its 34- and 100-day Chaikin money flow histograms (not shown) are still suggesting that the bulls are firmly in control of this key banking stock and that any decline into the 40-day cycle low T/P zone ought to be viewed as a low-risk buying opportunity -- one especially well-suited to covered-call, swing, and trend-following traders. The 40-day cycle low is expected to occur sometime between February 21 and March 10, 2013, with the cycle low price anywhere between 10.85 and 11.58. Note that as many as eight price cycles are all due to bottom sometime between now and late March 2013, something that should be of great interest to financial sector bulls. |

|
| FIGURE 2: S&P 100. Note the incredible 50-day average trading volumes for BAC shares; the stock has been outperforming the majority of S&P 100/500 stocks over the past 13-, 26-, and 52-week periods. |
| Graphic provided by: TradeStation. |
| Graphic provided by: TradeStation Radar Screen. |
| |
| If this anticipated decline into the 40-day T/P zone happens, one of the simplest ways to play it is to do the following: 1. Look for BAC to drop at least halfway down into its 40-day T/P zone. 2. Wait for a break above the red 7.9-day valid trendline (VTL). 3. Sell a near-term, out-of-the-money (OTM) put option, one with a strike price that is below $10.58, which is the maximum anticipated low for the decline into the 40-day cycle. It's still a bit early to do this, but for now, monitor the following puts to see which one would work best, depending on when BAC actually makes its low: 1. The March '13 BAC $10 put; open interest is 65,000-plus contracts. 2. The April '13 BAC $10 puts; open interest is 54,000-plus contracts. Implied volatilities for both options could increase as BAC declines, thus pumping up the value of the puts, offering nimble traders an extra edge. In addition, more aggressive traders could instead opt to sell the $11.00 BAC puts, but only after a low has been confirmed by the break back above the 7.9-day VTL (currently near $11.50). Even if this anticipated trade setup shapes up perfectly, don't forget to risk no more than 1% to 2% of your account value of this (or any other) stock or option trade. Trade wisely until we meet here again. |
Freelance financial markets writer and online publisher of the Trendzetterz.com S&P 500 Weekly Forecast service.
| Title: | Market consultant and writer |
| Company: | Trendzetterz |
| Address: | 81 Hickory Hollow Drive |
| Crossville, TN 38555 | |
| Phone # for sales: | 904-303-4814 |
| Website: | trendzetterz.com |
| E-mail address: | support@trendzetterz.com |
Traders' Resource Links | |
| Trendzetterz has not added any product or service information to TRADERS' RESOURCE. | |
Click here for more information about our publications!
Comments

Request Information From Our Sponsors
- StockCharts.com, Inc.
- Candle Patterns
- Candlestick Charting Explained
- Intermarket Technical Analysis
- John Murphy on Chart Analysis
- John Murphy's Chart Pattern Recognition
- John Murphy's Market Message
- MurphyExplainsMarketAnalysis-Intermarket Analysis
- MurphyExplainsMarketAnalysis-Visual Analysis
- StockCharts.com
- Technical Analysis of the Financial Markets
- The Visual Investor
- VectorVest, Inc.
- Executive Premier Workshop
- One-Day Options Course
- OptionsPro
- Retirement Income Workshop
- Sure-Fire Trading Systems (VectorVest, Inc.)
- Trading as a Business Workshop
- VectorVest 7 EOD
- VectorVest 7 RealTime/IntraDay
- VectorVest AutoTester
- VectorVest Educational Services
- VectorVest OnLine
- VectorVest Options Analyzer
- VectorVest ProGraphics v6.0
- VectorVest ProTrader 7
- VectorVest RealTime Derby Tool
- VectorVest Simulator
- VectorVest Variator
- VectorVest Watchdog
