HOT TOPICS LIST
- MACD
- Fibonacci
- RSI
- Gann
- ADXR
- Stochastics
- Volume
- Triangles
- Futures
- Cycles
- Volatility
- ZIGZAG
- MESA
- Retracement
- Aroon
INDICATORS LIST
LIST OF TOPICS
PRINT THIS ARTICLE
by Matt Blackman
With the race by central banks around the globe to see who can devalue their currencies the fastest since the financial crisis, gold has been on fire. And now there is a pattern forming that could propel the yellow metal even higher.
Position: Buy
Matt Blackman
Matt Blackman is a full-time technical and financial writer and trader. He produces corporate and financial newsletters, and assists clients in getting published in the mainstream media. He is the host of TradeSystemGuru.com. Matt has earned the Chartered Market Technician (CMT) designation. Find out what stocks and futures Matt is watching on Twitter at www.twitter.com/RatioTrade
PRINT THIS ARTICLE
SYMMETRICAL TRIANGLE
Will The Golden Triangle Pan Out?
02/13/13 08:22:40 AMby Matt Blackman
With the race by central banks around the globe to see who can devalue their currencies the fastest since the financial crisis, gold has been on fire. And now there is a pattern forming that could propel the yellow metal even higher.
Position: Buy
| According to author and analyst Suri Duddella, a symmetrical triangle forms when the market is in indecision mode and supply and demand are in equilibrium. Trades are initiated when price breaks above or below the triangle. The trade target equals the entire height of the pattern added to the point of breakout. According to Duddella, "Most symmetrical triangles result in a clear breakout or breakdown in the direction of the prior trend." |
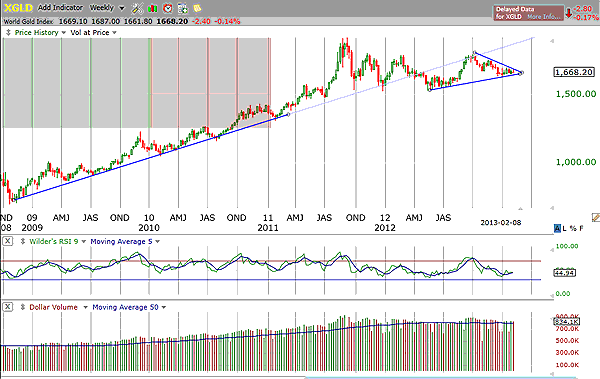
| As Figure 1 of the World Gold Index (XGLD) shows, the primary trend is clearly up. The height of the triangle is 1785 - 1540 = 245, which when added to the recent price of 1670 suggests an upside target on the index of around 1915, just below its September 2011 high of 1920. Since its low of 692 in October 2008, the index is still up more than 140%. |

|
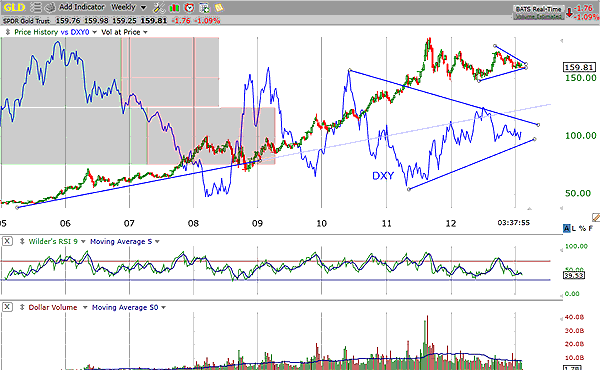
| FIGURE 1: SPDRs GOLD TRUST ETF (GLD) AND US DOLLAR INDEX (DXY), WEEKLY. Both are posting symmetrical triangles but with opposite directional breakout targets. |
| Graphic provided by: TC2000.com. |
| |
| In the case of the SPDRs Gold Trust ETF (GLD) in Figure 2, the height of the triangle in the process of forming is approximately $25 and the price at the apex is $160, which implies a target price of $195 if the breakout is successful. This would translate to a price of $1,915 per ounce of gold. It is interesting to note that the bigger triangle on DXY in Figure 2 has a height of approximately 88 - 73, or 15 points, which implies a downside target price of 65 for the US Dollar Index as the Federal Reserve continues devaluing the dollar. |

|
| FIGURE 2: WORLD GOLD INDEX (XGLD), WEEKLY. From its 2008 low showing the strong uptrend and the recent symmetrical triangle. |
| Graphic provided by: TC2000.com. |
| |
| It is doubtful that we will see any sizable drop in precious metal prices in the ongoing central bank race to devalue currencies, given the political fiscally irresponsible attitudes that exist these days. So it's not a matter of if but when gold surges past $2,000 an ounce. However, there is always the possibility of a false breakout from the triangles in these charts. Duddella suggests that stops be placed just below the first major swing up in case gold prices do temporarily break down after the breakout, which would get the trader out of the trade by the time the upper triangle trendline is broken to the downside. |
| SUGGESTED READING Duddella, Suri (2008). Trade Like The Pros, www.SuriNotes.com. |
Matt Blackman is a full-time technical and financial writer and trader. He produces corporate and financial newsletters, and assists clients in getting published in the mainstream media. He is the host of TradeSystemGuru.com. Matt has earned the Chartered Market Technician (CMT) designation. Find out what stocks and futures Matt is watching on Twitter at www.twitter.com/RatioTrade
| Company: | TradeSystemGuru.com |
| Address: | Box 2589 |
| Garibaldi Highlands, BC Canada | |
| Phone # for sales: | 604-898-9069 |
| Fax: | 604-898-9069 |
| Website: | www.tradesystemguru.com |
| E-mail address: | indextradermb@gmail.com |
Traders' Resource Links | |
| TradeSystemGuru.com has not added any product or service information to TRADERS' RESOURCE. | |
Click here for more information about our publications!
Comments
Date: 02/13/13Rank: 5Comment:

Request Information From Our Sponsors
- StockCharts.com, Inc.
- Candle Patterns
- Candlestick Charting Explained
- Intermarket Technical Analysis
- John Murphy on Chart Analysis
- John Murphy's Chart Pattern Recognition
- John Murphy's Market Message
- MurphyExplainsMarketAnalysis-Intermarket Analysis
- MurphyExplainsMarketAnalysis-Visual Analysis
- StockCharts.com
- Technical Analysis of the Financial Markets
- The Visual Investor
- VectorVest, Inc.
- Executive Premier Workshop
- One-Day Options Course
- OptionsPro
- Retirement Income Workshop
- Sure-Fire Trading Systems (VectorVest, Inc.)
- Trading as a Business Workshop
- VectorVest 7 EOD
- VectorVest 7 RealTime/IntraDay
- VectorVest AutoTester
- VectorVest Educational Services
- VectorVest OnLine
- VectorVest Options Analyzer
- VectorVest ProGraphics v6.0
- VectorVest ProTrader 7
- VectorVest RealTime Derby Tool
- VectorVest Simulator
- VectorVest Variator
- VectorVest Watchdog
