HOT TOPICS LIST
- MACD
- Fibonacci
- RSI
- Gann
- ADXR
- Stochastics
- Volume
- Triangles
- Futures
- Cycles
- Volatility
- ZIGZAG
- MESA
- Retracement
- Aroon
INDICATORS LIST
LIST OF TOPICS
PRINT THIS ARTICLE
by Donald W. Pendergast, Jr.
Shares of Morgan Stanley are up by more than 90% since early summer 2012, but its key technicals warn of an impending correction.
Position: N/A
Donald W. Pendergast, Jr.
Freelance financial markets writer and online publisher of the Trendzetterz.com S&P 500 Weekly Forecast service.
PRINT THIS ARTICLE
KELTNER CHANNELS
Morgan Stanley Correction Overdue?
02/13/13 08:12:23 AMby Donald W. Pendergast, Jr.
Shares of Morgan Stanley are up by more than 90% since early summer 2012, but its key technicals warn of an impending correction.
Position: N/A
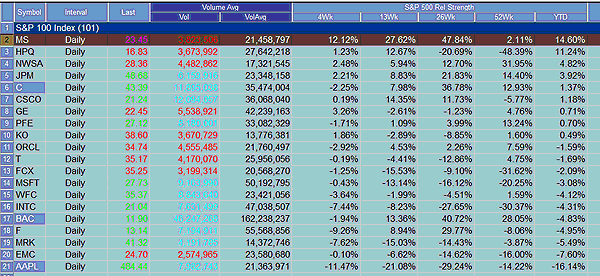
| Of all the high average daily volume Standard & Poor's 100 stocks, none are off to a stronger start in 2013 than shares of Morgan Stanley (MS). Up by more than 14% in just six weeks, the stock continues to impress fundamental and technical traders/investors alike. But how many of those market analysts and players are aware that MS is now trading at extremely high levels that are statistically likely to lead to a meaningful correction within the next few weeks? Here's a closer look at MS (Figures 1 and 2), one that is clearly warning of a correction dead ahead. |

|
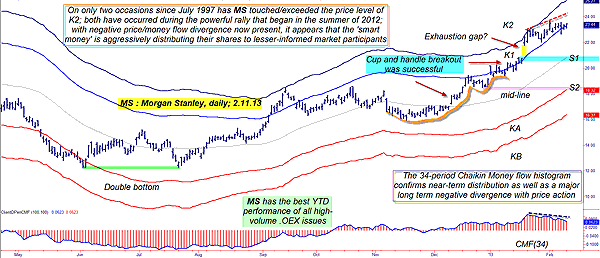
| FIGURE 1: MS, daily. MS has only touched and/or exceeded K2 on two occasions in the past 15-1/2 years; a sharp correction is becoming more probable with each passing day. |
| Graphic provided by: TradeStation. |
| |
| Between June and July 2012, MS completed an easy to see double-bottom pattern (as did many other S&P 100/500 stocks), one that also coincided with a confirmed, major multicycle low. A tradable rally ensued, one that formed in two major up waves, the first of which ran as high as 18.50 on September 14, 2012, before being stopped in its tracks by the upper Keltner band (K2). A period of pullback and then consolidation occurred (mid-September to early November 2012) before another decline and consolidation, thus setting up another powerful thrust higher. This second wave's bullish run (which launched higher from a very attractive cup with handle pattern) also was cut shortly after exceeding K2 on January 22, 2013. Yet another run higher toward K2 failed on February 1, 2013, and the stock is now in a small-range consolidation pattern, waiting to see which way investors and traders want to push it in the days and weeks ahead. At the same time that the latest run higher to K2 took place, the stock's medium-term money flow histogram (based on the 34-day Chaikin money flow indicator [CMF][34]) was manifesting a serious negative divergence with price action, warning that distribution was already under way. In fact, based on more distant swing highs in MS, this same histogram peak is warning of an even larger-degree distribution process, one that is likely to lead to a sharp correction commencing later this month. |

|
| FIGURE 2: OEX. Shares of Morgan Stanley (MS) are off to a red-hot start in 2013, far outperforming all other high daily volume .OEX issues. |
| Graphic provided by: TradeStation. |
| Graphic provided by: TradeStation Radar Screen. |
| |
| All of this price and technical action makes for a simple trade setup in MS. If you see the last minor swing low of $22.67 breached to the downside, that's your trigger to either short MS outright or to buy put options with at least two to three months of time value. The price target for MS is S1 (near $20.80/$20.90), which is an agreed support level formed by the Keltner midline and the bottom of the open gap of January 18, 2013. Short sellers of MS should use a two- to three-bar trailing stop of the daily highs to manage the trade, while put buyers need to use a percentage-based trade management plan as follows: 1. If MS reaches $20.90 or the put doubles in price, sell it and collect a nice profit. 2. If the put declines in value by 45% to 50% or if MS rises above $23.58, sell it for a loss and wait for a better opportunity. Keep your trade risk small (no more than 1% to 2% of your account size), no matter how attractive this potential short setup in MS looks. Doing so can help make you a long-term market winner by making sure that you don't suffer overly large losses on any given trade. Trade wisely until we meet here again. |
Freelance financial markets writer and online publisher of the Trendzetterz.com S&P 500 Weekly Forecast service.
| Title: | Market consultant and writer |
| Company: | Trendzetterz |
| Address: | 81 Hickory Hollow Drive |
| Crossville, TN 38555 | |
| Phone # for sales: | 904-303-4814 |
| Website: | trendzetterz.com |
| E-mail address: | support@trendzetterz.com |
Traders' Resource Links | |
| Trendzetterz has not added any product or service information to TRADERS' RESOURCE. | |
Click here for more information about our publications!
PRINT THIS ARTICLE

Request Information From Our Sponsors
- StockCharts.com, Inc.
- Candle Patterns
- Candlestick Charting Explained
- Intermarket Technical Analysis
- John Murphy on Chart Analysis
- John Murphy's Chart Pattern Recognition
- John Murphy's Market Message
- MurphyExplainsMarketAnalysis-Intermarket Analysis
- MurphyExplainsMarketAnalysis-Visual Analysis
- StockCharts.com
- Technical Analysis of the Financial Markets
- The Visual Investor
- VectorVest, Inc.
- Executive Premier Workshop
- One-Day Options Course
- OptionsPro
- Retirement Income Workshop
- Sure-Fire Trading Systems (VectorVest, Inc.)
- Trading as a Business Workshop
- VectorVest 7 EOD
- VectorVest 7 RealTime/IntraDay
- VectorVest AutoTester
- VectorVest Educational Services
- VectorVest OnLine
- VectorVest Options Analyzer
- VectorVest ProGraphics v6.0
- VectorVest ProTrader 7
- VectorVest RealTime Derby Tool
- VectorVest Simulator
- VectorVest Variator
- VectorVest Watchdog
