HOT TOPICS LIST
- MACD
- Fibonacci
- RSI
- Gann
- ADXR
- Stochastics
- Volume
- Triangles
- Futures
- Cycles
- Volatility
- ZIGZAG
- MESA
- Retracement
- Aroon
INDICATORS LIST
LIST OF TOPICS
PRINT THIS ARTICLE
by Koos van der Merwe
We know that a correction is on the cards. But what do the daily indexes tell us?
Position: Buy
Koos van der Merwe
Has been a technical analyst since 1969, and has worked as a futures and options trader with First Financial Futures in Johannesburg, South Africa.
PRINT THIS ARTICLE
TECHNICAL ANALYSIS
Do The Indexes Call For A Correction?
02/12/13 08:38:42 AMby Koos van der Merwe
We know that a correction is on the cards. But what do the daily indexes tell us?
Position: Buy
| When the market rises as consistently as it has, all the bears come out of the woods and shout, "A correction is on the cards!" We all know that one must occur, but will it be the "Sell in May and go away" variety or will it be sooner that that? Looking at all the indexes on a daily basis shows the following. |

|
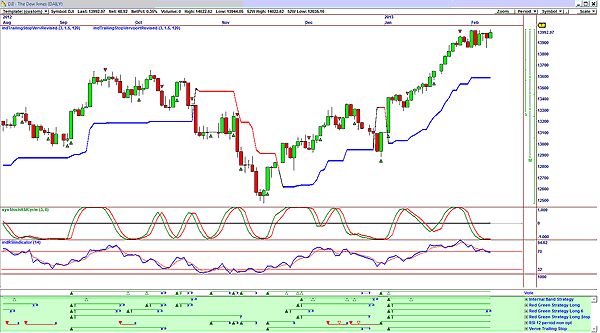
| FIGURE 1: DJIA, DAILY |
| Graphic provided by: OmniTrader. |
| |
| Figure 1 is a daily chart of the Dow Jones Industrial Average (DJIA). The vote line is still in a buy mode. The relative strength index (RSI) is trending down but the stochastic RSI is oversold, not yet suggesting a buy signal, but possibly soon. |

|
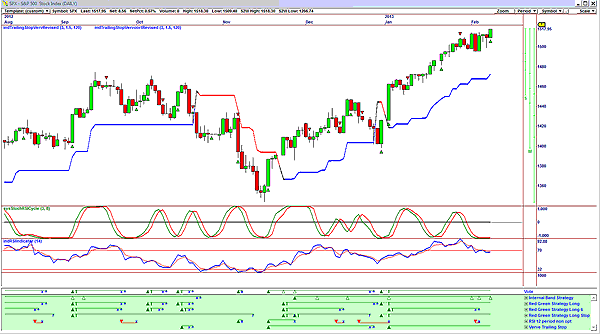
| FIGURE 2: S&P 500, DAILY |
| Graphic provided by: OmniTrader. |
| |
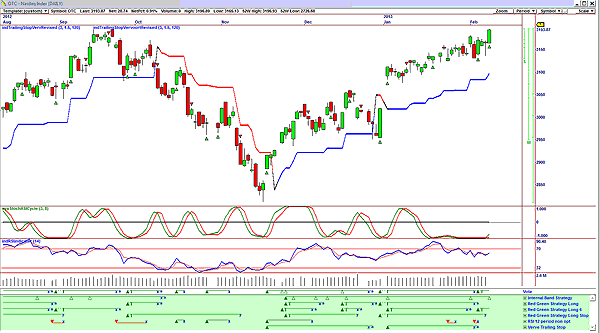
| Figure 2 is a daily chart of the Standard & Poor's 500. As you can see, the vote line is also positive, with the RSI looking bearish, but the stochastic RSI in an oversold position looking as if it will give a buy signal in the near future. Figure 3 is a daily chart of the NASDAQ. |

|
| FIGURE 3: NASDAQ, DAILY |
| Graphic provided by: OmniTrader. |
| |
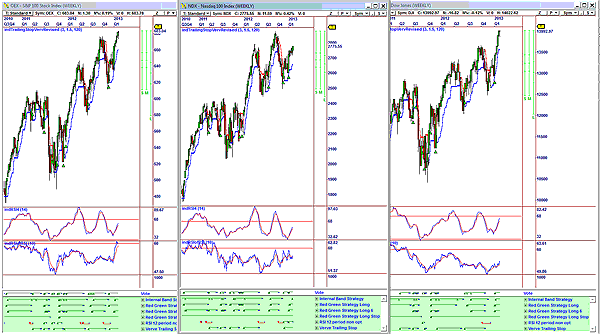
| Figure 4 is a weekly chart of all three indexes. They all look identical. The vote line is positive, and the RSI is approaching overbought levels. The indicator RSI of an RSI for the DJIA, is still showing an uptrend, but the S&P 100 is at overbought levels, with the NASDAQ looking undecided. Of course, a correction after a strong rise is always on the cards, and expected. At the moment, though, both the daily and weekly charts are not calling for a correction. |

|
| FIGURE 4: THREE INDEXES, WEEKLY. Here, I have used the S&P 100 rather then the 500. |
| Graphic provided by: OmniTrader. |
| |
Has been a technical analyst since 1969, and has worked as a futures and options trader with First Financial Futures in Johannesburg, South Africa.
| Address: | 3256 West 24th Ave |
| Vancouver, BC | |
| Phone # for sales: | 6042634214 |
| E-mail address: | petroosp@gmail.com |
Click here for more information about our publications!
PRINT THIS ARTICLE

Request Information From Our Sponsors
- StockCharts.com, Inc.
- Candle Patterns
- Candlestick Charting Explained
- Intermarket Technical Analysis
- John Murphy on Chart Analysis
- John Murphy's Chart Pattern Recognition
- John Murphy's Market Message
- MurphyExplainsMarketAnalysis-Intermarket Analysis
- MurphyExplainsMarketAnalysis-Visual Analysis
- StockCharts.com
- Technical Analysis of the Financial Markets
- The Visual Investor
- VectorVest, Inc.
- Executive Premier Workshop
- One-Day Options Course
- OptionsPro
- Retirement Income Workshop
- Sure-Fire Trading Systems (VectorVest, Inc.)
- Trading as a Business Workshop
- VectorVest 7 EOD
- VectorVest 7 RealTime/IntraDay
- VectorVest AutoTester
- VectorVest Educational Services
- VectorVest OnLine
- VectorVest Options Analyzer
- VectorVest ProGraphics v6.0
- VectorVest ProTrader 7
- VectorVest RealTime Derby Tool
- VectorVest Simulator
- VectorVest Variator
- VectorVest Watchdog
