

HOT TOPICS LIST
- MACD
- Fibonacci
- RSI
- Gann
- ADXR
- Stochastics
- Volume
- Triangles
- Futures
- Cycles
- Volatility
- ZIGZAG
- MESA
- Retracement
- Aroon
INDICATORS LIST
LIST OF TOPICS
PRINT THIS ARTICLE
by Koos van der Merwe
Investing in an airline is always risky. As the price of oil rises, so do their costs.
Position: Sell
Koos van der Merwe
Has been a technical analyst since 1969, and has worked as a futures and options trader with First Financial Futures in Johannesburg, South Africa.
PRINT THIS ARTICLE
TRIANGLES
A Diamond For WestJet Airlines?
02/11/13 08:33:30 AMby Koos van der Merwe
Investing in an airline is always risky. As the price of oil rises, so do their costs.
Position: Sell
| One of the worst shares to buy, shares of companies that are always risky, is that of airline companies. We all remember how in the past, they competed with each other by offering passengers luxury, if not in food served while traveling, then in service. Today with the price of oil at extremely high levels; with unions continuing to threaten strikes to improve the salaries of workers; with security at airports increasing the cost of airport fees for the airline companies, it has become risky to invest in an airline stock. Finding one that is top class is not easy, and when found, there is always that tickling feeling of doubt in one's mind. WestJet Airlines (WJA-T) is a Canadian airline company that appears to have found a way to capture investors. |
|
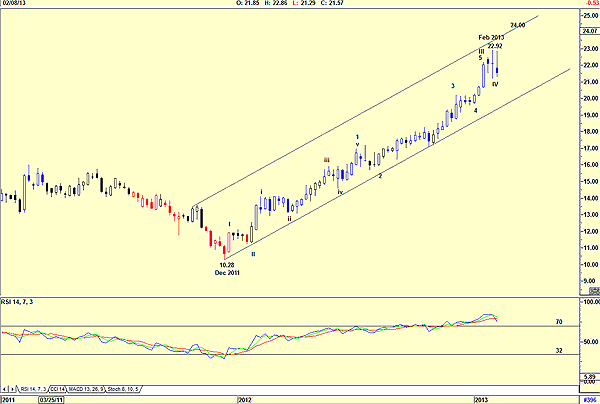
| FIGURE 1: WJA, WEEKLY |
| Graphic provided by: AdvancedGET. |
| |
| Figure 1 is a weekly chart showing how the share price has risen strongly from a low of $10.28 in December 2011 to a high of $22.92 by February 2013. The chart shows the relative strength index (RSI) at overbought levels and the two moving averages on the RSI are both suggesting a sell signal. The price could rise to test the upper resistance level at $24.00, with the RSI moving sideways before falling below the 70 level, confirming a sell signal. My Elliott wave count does suggest that a wave V is still on the cards. |
|
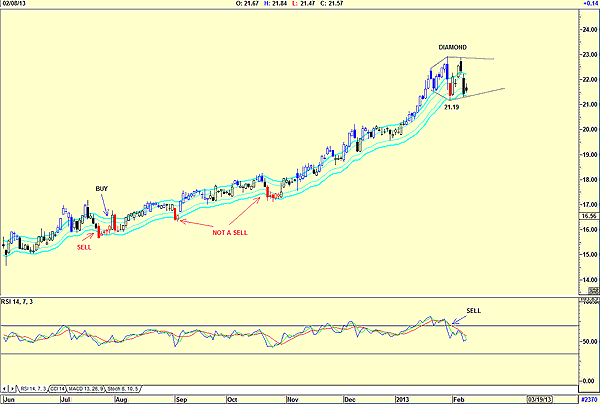
| FIGURE 2: WJA, DAILY |
| Graphic provided by: AdvancedGET. |
| |
| Figure 2 is a daily chart that shows how the price continually tested the lower JM internal band without the closing price breaking it and giving a sell signal. The chart does show the diamond formation that has formed, suggesting uncertainty and leaning toward weakness. The RSI on the chart has given a sell signal and is falling. The price, however, has not given a sell signal by breaking below the lower JM internal band. A JM internal band is a 2% simple moving average offset by 2% positive and 2% negative. |
|
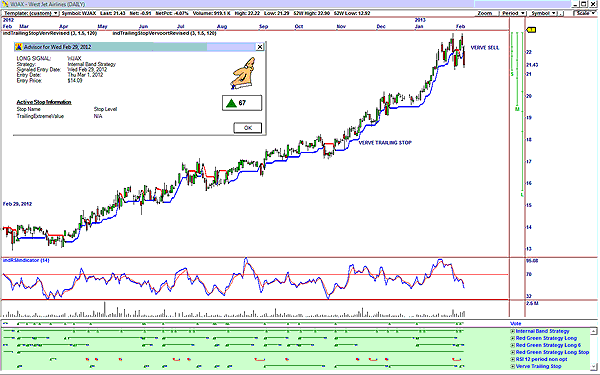
| FIGURE 3: WJA, DAILY |
| Graphic provided by: OmniTrader. |
| |
| Figure 3 shows the vote line giving a buy signal on February 28, 2012, based on a summation of all the strategies, with the exception of the RSI 12-period. This is a very strong signal. The advisor rating shown on the chart is 67. The price has given a Verve trailing stop sell, even though the vote line is still positive. WestJet is a share that I would sell at the moment. I would keep it on my watchlist though, looking for a buy signal sometime in the future. |
Has been a technical analyst since 1969, and has worked as a futures and options trader with First Financial Futures in Johannesburg, South Africa.
| Address: | 3256 West 24th Ave |
| Vancouver, BC | |
| Phone # for sales: | 6042634214 |
| E-mail address: | petroosp@gmail.com |
Click here for more information about our publications!
PRINT THIS ARTICLE

Request Information From Our Sponsors
- StockCharts.com, Inc.
- Candle Patterns
- Candlestick Charting Explained
- Intermarket Technical Analysis
- John Murphy on Chart Analysis
- John Murphy's Chart Pattern Recognition
- John Murphy's Market Message
- MurphyExplainsMarketAnalysis-Intermarket Analysis
- MurphyExplainsMarketAnalysis-Visual Analysis
- StockCharts.com
- Technical Analysis of the Financial Markets
- The Visual Investor
- VectorVest, Inc.
- Executive Premier Workshop
- One-Day Options Course
- OptionsPro
- Retirement Income Workshop
- Sure-Fire Trading Systems (VectorVest, Inc.)
- Trading as a Business Workshop
- VectorVest 7 EOD
- VectorVest 7 RealTime/IntraDay
- VectorVest AutoTester
- VectorVest Educational Services
- VectorVest OnLine
- VectorVest Options Analyzer
- VectorVest ProGraphics v6.0
- VectorVest ProTrader 7
- VectorVest RealTime Derby Tool
- VectorVest Simulator
- VectorVest Variator
- VectorVest Watchdog