HOT TOPICS LIST
- MACD
- Fibonacci
- RSI
- Gann
- ADXR
- Stochastics
- Volume
- Triangles
- Futures
- Cycles
- Volatility
- ZIGZAG
- MESA
- Retracement
- Aroon
INDICATORS LIST
LIST OF TOPICS
PRINT THIS ARTICLE
by Donald W. Pendergast, Jr.
Shares of Lowe's Cos. are up by nearly 60% since August 2012, but negative price money flow divergences are warning that a significant correction may soon take the stock lower.
Position: N/A
Donald W. Pendergast, Jr.
Freelance financial markets writer and online publisher of the Trendzetterz.com S&P 500 Weekly Forecast service.
PRINT THIS ARTICLE
KELTNER CHANNELS
LOW Negative Money Flow Divergences
02/11/13 12:14:24 PMby Donald W. Pendergast, Jr.
Shares of Lowe's Cos. are up by nearly 60% since August 2012, but negative price money flow divergences are warning that a significant correction may soon take the stock lower.
Position: N/A
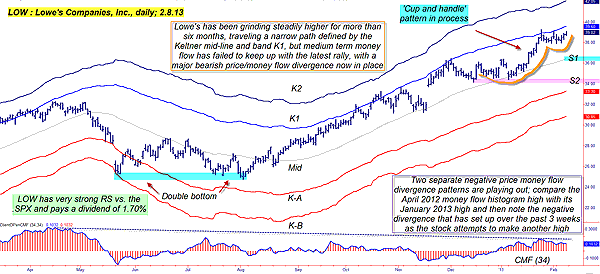
| Whenever a household-name, large-cap stock starts to outperform the major stock indexes in a big way, it's typical to see latecomers who missed the first part of the rally start to pile into the issue, driving it higher still, which draws in another round of even tardier investors, which then drives the stock up again -- until finally there are no more latecomers for the smart-money early birds to sell their well-appreciated shares to. Then a large correction and/or trend reversal starts, bringing the stock down to a level more in line with its long-term fundamentals. In the case of Lowe's Cos. (LOW) shares, it appears that the smart money folks may soon be out of latecomers to distribute their shares to. In fact, since late September 2012, LOW has been under distribution and it's the less-savvy market players who have been the driving force in the stock's runup since then. Here's a look at LOW's daily chart, where some very interesting technicals and price patterns are playing out; all seem to be warning of a near-term decline of some degree. See Figure 1. |

|
| FIGURE 1: LOW, DAILY. With a nicely formed cup with handle pattern in place, latecomer bulls to the incredible Lowe's rally may be lured into buying near a new high -- just as the money flow patterns are warning of a significant correction ahead. |
| Graphic provided by: TradeStation. |
| |
| When LOW finally completed a major (if slightly off-kilter) double-bottom pattern in the summer of 2012, it wasn't surprising to see at least some sort of a rally ensue, but it's doubtful that any fundamentally based or technical trader could have envisioned just how strong and steady LOW's rally would ultimately become. The August 2012 portion of the double bottom was a major multicycle low, however, so at least a part of the ensuing rise could have been reasonably expected; many traders aren't aware of the existence of such cycles, giving a bit of a market edge to those who use them properly. Be that as it may, savvy technicians were aware that the 60% rally since then was being achieved on progressively weaker volume levels -- a sure tipoff that the bulk of the buying was being done by less-informed latecomers rather than by money-flow savvy traders/investors who began to build positions prior to the August 2012 low. |

|
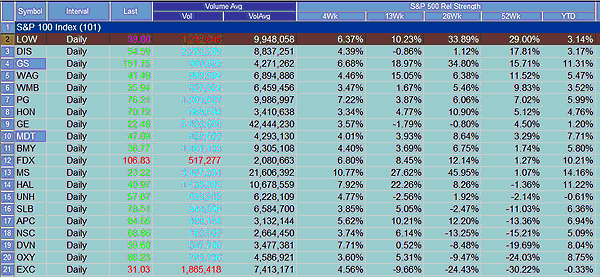
| FIGURE 2: OEX. LOW is one of the best-performing stocks in the S&P 100 (.OEX) over the past 52 weeks. |
| Graphic provided by: TradeStation. |
| Graphic provided by: TradeStation Radar Screen. |
| |
| A fascinating aspect of LOW's rise has been its almost eerie ability to trend within the Keltner midline and band K1, for more than five months now. With the stock now close to touching band K1 again -- at the same time that a cup with handle pattern has formed -- sets up a very interesting battle zone in which the bulls and bears are sure to go to war. The bulls are biased to keep the rally going, and since the cup with handle (C+H) is a bullish pattern, those who are unaware of the heavily bearish money flow divergence in LOW may get suckered into going long on a break above $39.26, only to quickly reverse course, thus accelerating the anticipated near-term downturn in LOW. How low will LOW go, anyway, should the C+H pattern fail to hold water? The lowdown here is that once $37.92 is breached, LOW is likely to drop quickly down toward support zone 1 (S1) near the Keltner midline at $36.00. More enduring support resides beneath S1 near the $34.00/$34.40 area (S2). Existing longs in LOW need to be running a logical trailing stop, scaling out and/or buying put options now, depending on how large their risk exposure is in this stock. Speculative bears might want to buy the April '13 $38.00 put(s), which offer a close bid/ask spread of $0.03, daily time decay (theta) of only $1 per day/per contract, and an open interest figure of nearly 10,000 contracts. See Figure 2. If LOW breaks below $37.92, that's the trigger to buy these puts, risking no more than 1% to 2% of your account equity on the trade. The Keltner midline is the ideal profit target, so if you see the stock quickly drop toward the $36.25 area shortly after purchase of the puts, consider that your invitation to sell out and walk away happy. The midline usually acts as a strong support (resistance) barrier and there's no reason to believe that it won't offer support on this anticipated decline, either. |
| Until $37.92 breaks, watch to see if the C+H pattern fails, because that will be your first confirmation that LOW intends to drop back down toward major support. Trade wisely until we meet here again. |
Freelance financial markets writer and online publisher of the Trendzetterz.com S&P 500 Weekly Forecast service.
| Title: | Market consultant and writer |
| Company: | Trendzetterz |
| Address: | 81 Hickory Hollow Drive |
| Crossville, TN 38555 | |
| Phone # for sales: | 904-303-4814 |
| Website: | trendzetterz.com |
| E-mail address: | support@trendzetterz.com |
Traders' Resource Links | |
| Trendzetterz has not added any product or service information to TRADERS' RESOURCE. | |
Click here for more information about our publications!
PRINT THIS ARTICLE

Request Information From Our Sponsors
- StockCharts.com, Inc.
- Candle Patterns
- Candlestick Charting Explained
- Intermarket Technical Analysis
- John Murphy on Chart Analysis
- John Murphy's Chart Pattern Recognition
- John Murphy's Market Message
- MurphyExplainsMarketAnalysis-Intermarket Analysis
- MurphyExplainsMarketAnalysis-Visual Analysis
- StockCharts.com
- Technical Analysis of the Financial Markets
- The Visual Investor
- VectorVest, Inc.
- Executive Premier Workshop
- One-Day Options Course
- OptionsPro
- Retirement Income Workshop
- Sure-Fire Trading Systems (VectorVest, Inc.)
- Trading as a Business Workshop
- VectorVest 7 EOD
- VectorVest 7 RealTime/IntraDay
- VectorVest AutoTester
- VectorVest Educational Services
- VectorVest OnLine
- VectorVest Options Analyzer
- VectorVest ProGraphics v6.0
- VectorVest ProTrader 7
- VectorVest RealTime Derby Tool
- VectorVest Simulator
- VectorVest Variator
- VectorVest Watchdog
