HOT TOPICS LIST
- MACD
- Fibonacci
- RSI
- Gann
- ADXR
- Stochastics
- Volume
- Triangles
- Futures
- Cycles
- Volatility
- ZIGZAG
- MESA
- Retracement
- Aroon
INDICATORS LIST
LIST OF TOPICS
PRINT THIS ARTICLE
by Koos van der Merwe
There's a rumor going around that Apple TV, when it is available, might be accessible via the Internet and not cable. How's Comcast reacting to those whispers?
Position: Buy
Koos van der Merwe
Has been a technical analyst since 1969, and has worked as a futures and options trader with First Financial Futures in Johannesburg, South Africa.
PRINT THIS ARTICLE
TECHNICAL ANALYSIS
Comcast Corp. Waits On Apple Rumors
02/08/13 09:20:20 AMby Koos van der Merwe
There's a rumor going around that Apple TV, when it is available, might be accessible via the Internet and not cable. How's Comcast reacting to those whispers?
Position: Buy
| The stock market lives on rumors. The newest one is about Apple TV, which they say will be run off the Internet, similar to Netflix, and not off cable or otherwise. With Apple's previous innovation, this is very possible. However, a rumor is a rumor is a rumor, and until Apple introduces its TV, if it ever does, we should just keep it in mind. Comcast (CMCSK) is the largest cable operator, one of the biggest mass media, home Internet service providers, and third-largest home telephone service provider in the US. I am sure the company is aware of the rumors about Apple TV, and will react with strength. |

|
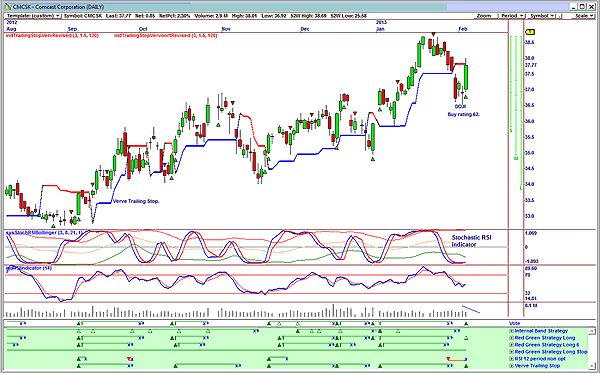
| FIGURE 1: COMCAST. This chart shows a buy signal on a vote line. |
| Graphic provided by: OmniTrader. |
| |
| Figure 1 is the chart that brought the company to my attention. The vote line on the chart has given a buy signal with a rating of 62. The buy signal was given by two strategies, the red green strategy long and the Verve trailing stop. A lookback over previous vote line buy signals show that the signals have been successful. The StochasticRSI indicator on the chart is at oversold levels and the relative strength index (RSI), although not at or below the 32 level, does appear to be turning. A negative is that the rise in the share on February 5 was on falling volume. Do note the doji pattern that forecast the change of direction of the share price. |

|
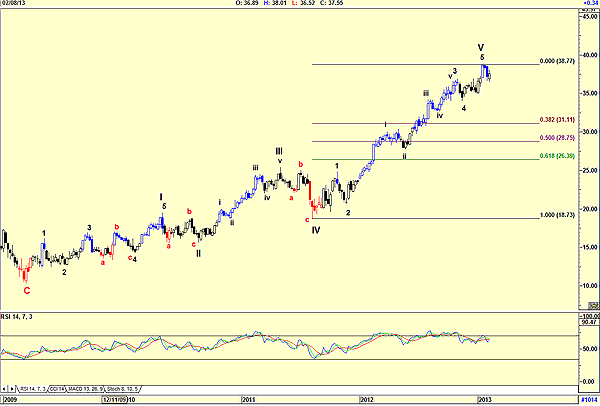
| FIGURE 2: COMCAST, WEEKLY. Here's a chart showing an Elliott wave count. |
| Graphic provided by: AdvancedGET. |
| |
| Figure 2 is a weekly chart with an Elliott wave count suggesting that a wave V has been completed, and that an ABC correction could now be in the works. This is confirmed by the RSI, which has given a sell signal and is moving down from overbought levels. A Fibonacci retracement is suggesting a correction to 31.11 (38.2%), 28.75 (50%), or 26.39 (61.8%). Traders could buy the share with a stop that is close to the chest. Investors, however, should wait for the weekly chart to complete the ABC correction, and buy only when the RSI confirms a daily buy signal. |
Has been a technical analyst since 1969, and has worked as a futures and options trader with First Financial Futures in Johannesburg, South Africa.
| Address: | 3256 West 24th Ave |
| Vancouver, BC | |
| Phone # for sales: | 6042634214 |
| E-mail address: | petroosp@gmail.com |
Click here for more information about our publications!
PRINT THIS ARTICLE

Request Information From Our Sponsors
- StockCharts.com, Inc.
- Candle Patterns
- Candlestick Charting Explained
- Intermarket Technical Analysis
- John Murphy on Chart Analysis
- John Murphy's Chart Pattern Recognition
- John Murphy's Market Message
- MurphyExplainsMarketAnalysis-Intermarket Analysis
- MurphyExplainsMarketAnalysis-Visual Analysis
- StockCharts.com
- Technical Analysis of the Financial Markets
- The Visual Investor
- VectorVest, Inc.
- Executive Premier Workshop
- One-Day Options Course
- OptionsPro
- Retirement Income Workshop
- Sure-Fire Trading Systems (VectorVest, Inc.)
- Trading as a Business Workshop
- VectorVest 7 EOD
- VectorVest 7 RealTime/IntraDay
- VectorVest AutoTester
- VectorVest Educational Services
- VectorVest OnLine
- VectorVest Options Analyzer
- VectorVest ProGraphics v6.0
- VectorVest ProTrader 7
- VectorVest RealTime Derby Tool
- VectorVest Simulator
- VectorVest Variator
- VectorVest Watchdog
