HOT TOPICS LIST
- MACD
- Fibonacci
- RSI
- Gann
- ADXR
- Stochastics
- Volume
- Triangles
- Futures
- Cycles
- Volatility
- ZIGZAG
- MESA
- Retracement
- Aroon
INDICATORS LIST
LIST OF TOPICS
PRINT THIS ARTICLE
by Donald W. Pendergast, Jr.
Up by more than 30% in fewer than three months, shares of Cameco Corp. may be setting up for yet another push higher.
Position: N/A
Donald W. Pendergast, Jr.
Freelance financial markets writer and online publisher of the Trendzetterz.com S&P 500 Weekly Forecast service.
PRINT THIS ARTICLE
SUPPORT & RESISTANCE
CCJ's Successful Support Test Completed?
02/06/13 08:08:50 AMby Donald W. Pendergast, Jr.
Up by more than 30% in fewer than three months, shares of Cameco Corp. may be setting up for yet another push higher.
Position: N/A
| Shares of Cameco Corp. (CCJ) completed a major multicycle low on November 16, 2012 and have enjoyed a very powerful rally over the past 11 weeks of trading action; with the stock now up by 31% since that major low, and while some traders and investors might believe that the stock has risen too far, too fast, CCJ's daily technicals reveal that the stock may actually be setting up another break upward. Here's a closer look now. |

|
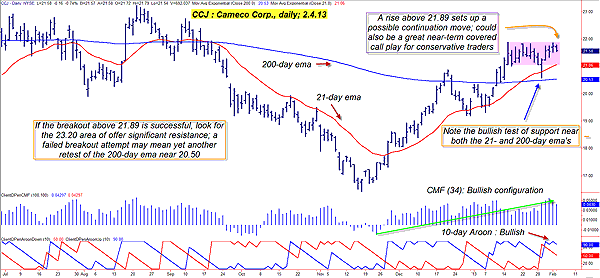
| FIGURE 1: CCJ, DAILY. The in-process rectangle pattern on CCJ's daily chart has bullish overtones, especially since the stock made a major multicycle low only 11 weeks ago. Probabilities seem to favor a bullish runup to the next major resistance area near 23.20. |
| Graphic provided by: TradeStation. |
| |
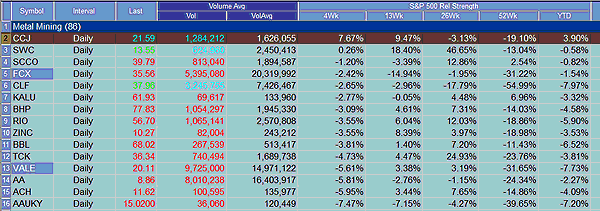
| One of the most interesting things shown on CCJ's daily chart (Figure 1) is the combined dynamic created by: 1. The consolidation phase (rectangle pattern) that the stock has formed over the past three weeks and 2. The successful test/retest of the stock's 200- and 21-day exponential moving averages (EMA). That the support test took place partway through the rectangle is significant, particularly since it was a one-time dip and not a multiple-day event. Even more important is the fact that the consolidation and support test took place after a sizable bullish run up from a major multicycle low; the probabilities now favor a bullish resolution of the rectangle, with CCJ likely to break higher from the pink shaded zone. In addition, CCJ has the best four-week relative strength performance of all of the higher-volume metals mining group stocks (based on the Reuters stock groups list within TradeStation's RadarScreen). CCJ's 13-week performance is also above average for the group, but the stock is lagging against the Standard & Poor's 500 (.SPX) during the last 26- and 52-week periods. See Figure 2. |

|
| FIGURE 2: CCJ VS. SPX. CCJ has been performing well against the .SPX over the last four- and 13-week periods, but has been underperforming longer term. |
| Graphic provided by: TradeStation. |
| Graphic provided by: TradeStation Radar Screen. |
| |
| Medium-term money flow (using the 34-day Chaikin money flow histogram) is looking quite bullish, which is another notch in the belt for CCJ bulls -- as is the bullish configuration of CCJ's 10-day AroonUp indicator, which is now at the $90.00 level. Taken as a whole, the entire chart paints a picture of a stock that may be in a temporary pause before another rally commences. One of the lower-risk ways to play CCJ here would be to put on near-term covered-call (CC) trade, one that stands to benefit from a resumption of CCJ's previous November-January rally. An attractive CC might be constructed by selling one March '13 CCJ $21.00 call for every 100 shares of CCJ purchased, but only if you see CCJ break above $21.89 within the next few trading sessions. This call has a delta of 0.63, daily time decay of $1 per day/per contract and an open interest figure of more than 1,100 contracts as this is written; the bid-ask spread is okay, but not exactly close. If filled on the trade (you can usually put on a CC trade as a complete unit [a buy-write] at a single price at many brokers), consider running a trailing stop just below the red 21-day EMA on the chart for the life of the trade, as this is a trailing stop that will give the CC enough room to fluctuate without stopping out the position prematurely. If CCJ closes above $21.00 on March 16, 2013, the stock will be called away and you will keep all of the option premiums, making for a net gain on the entire trade. A daily close below the 21-day EMA prior to option expiration would be your signal to liquidate the entire trade. Overall, this looks like a low-risk, modest profit CC play for conservative traders; make sure you keep it that way by risking no more than 1% to 2% of your account equity on this or any other stock, exchange traded fund, or stock option trade. Trade wisely until we meet here again. |
Freelance financial markets writer and online publisher of the Trendzetterz.com S&P 500 Weekly Forecast service.
| Title: | Market consultant and writer |
| Company: | Trendzetterz |
| Address: | 81 Hickory Hollow Drive |
| Crossville, TN 38555 | |
| Phone # for sales: | 904-303-4814 |
| Website: | trendzetterz.com |
| E-mail address: | support@trendzetterz.com |
Traders' Resource Links | |
| Trendzetterz has not added any product or service information to TRADERS' RESOURCE. | |
Click here for more information about our publications!
PRINT THIS ARTICLE

Request Information From Our Sponsors
- StockCharts.com, Inc.
- Candle Patterns
- Candlestick Charting Explained
- Intermarket Technical Analysis
- John Murphy on Chart Analysis
- John Murphy's Chart Pattern Recognition
- John Murphy's Market Message
- MurphyExplainsMarketAnalysis-Intermarket Analysis
- MurphyExplainsMarketAnalysis-Visual Analysis
- StockCharts.com
- Technical Analysis of the Financial Markets
- The Visual Investor
- VectorVest, Inc.
- Executive Premier Workshop
- One-Day Options Course
- OptionsPro
- Retirement Income Workshop
- Sure-Fire Trading Systems (VectorVest, Inc.)
- Trading as a Business Workshop
- VectorVest 7 EOD
- VectorVest 7 RealTime/IntraDay
- VectorVest AutoTester
- VectorVest Educational Services
- VectorVest OnLine
- VectorVest Options Analyzer
- VectorVest ProGraphics v6.0
- VectorVest ProTrader 7
- VectorVest RealTime Derby Tool
- VectorVest Simulator
- VectorVest Variator
- VectorVest Watchdog
