

HOT TOPICS LIST
- MACD
- Fibonacci
- RSI
- Gann
- ADXR
- Stochastics
- Volume
- Triangles
- Futures
- Cycles
- Volatility
- ZIGZAG
- MESA
- Retracement
- Aroon
INDICATORS LIST
LIST OF TOPICS
PRINT THIS ARTICLE
by Koos van der Merwe
The rule is, when everyone is buying, it is time to sell.
Position: Buy
Koos van der Merwe
Has been a technical analyst since 1969, and has worked as a futures and options trader with First Financial Futures in Johannesburg, South Africa.
PRINT THIS ARTICLE
ELLIOTT WAVE
Checking Out Bank Of America
02/06/13 01:02:36 PMby Koos van der Merwe
The rule is, when everyone is buying, it is time to sell.
Position: Buy
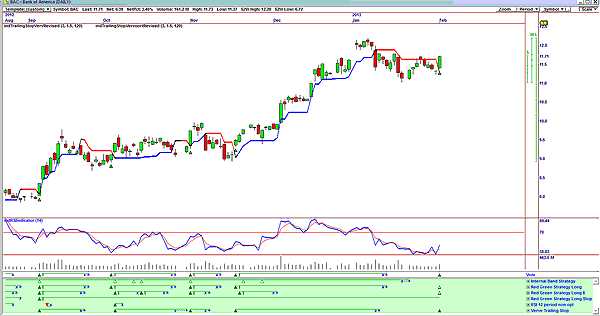
| When the market moves up fast as it has this past week, with the Dow Jones Industrial Average (DJIA) making new highs and breaking above the 14000 mark, then it is customary for all the diehard bears to start mouthing off. Yes, their chances of being correct is greater than 50%, so to bolster their reputation, why not mouth it? So when I hear them, then I know a major high is being approached, and I start analyzing my charts more thoroughly. Bank of America as shown in Figure 1 gave me a buy signal on February 1, February's first trading. How true is this signal? |
|
| FIGURE 1: BAC, DAILY. Bank of America is showing a buy signal on the vote line. |
| Graphic provided by: OmniTrader. |
| |
| As you can see in the daily chart of Figure 1, the vote line has given me a buy signal based on the summation of three strategies: the red green strategy long; the red green strategy long 6; the red green strategy long stop and the Verve trailing stop. A lookback on the chart at the vote line shows that it has been very accurate in its signals in the past. This buy signal is confirmed by a relative strength index (RSI) buy. Because I am concerned that perhaps the market has moved up too fast, I decided to examine the buy signal more closely. |
|
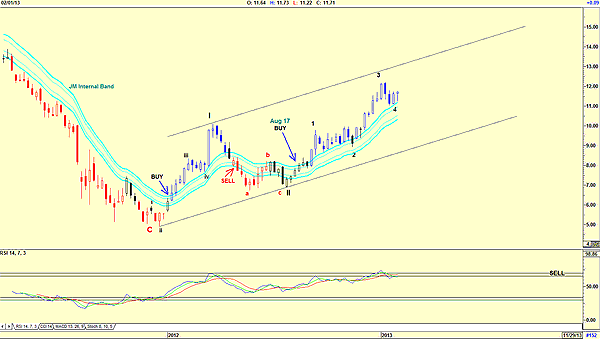
| FIGURE 2: BAC, WEEKLY. This chart shows an Elliott wave count. |
| Graphic provided by: AdvancedGET. |
| |
| Figure 2 is a weekly chart with an Elliott wave count suggesting that a wave 5 of a wave III is on the cards. The only negative is the RSI, which is suggesting a sell signal. The JM internal band gave a buy signal during the week of August 17 and has remained in buy mode ever since. The RSI is overbought and suggesting a sell signal. An Elliott wave count is suggesting that a wave 4 of wave III is on the cards. The upper resistance line is suggesting a target. |
|
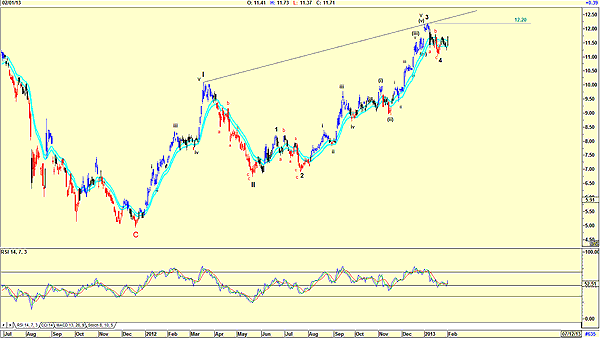
| FIGURE 3: BAC, DAILY. Here's a daily chart showing an Elliott wave count. |
| Graphic provided by: AdvancedGET. |
| |
| The daily chart in Figure 3 shows an RSI at the 50% mark. The past has shown that the indicator has found this level either as a resistance level or support level, depending on the wave count. The daily Elliott wave count is suggesting that Bank of America is in a wave 4 of wave III. With wave 2 of wave III being a complicated wave, the possibility of a simple formation as shown is possible. The wave 4 of wave III count will only being confirmed when the price rises above the $12.20 level. Until then, the count could indeed be suspect. I would be a buyer of Bank of America at current levels because of the buy signal given in Figure 1, but I would keep my stops close. |
Has been a technical analyst since 1969, and has worked as a futures and options trader with First Financial Futures in Johannesburg, South Africa.
| Address: | 3256 West 24th Ave |
| Vancouver, BC | |
| Phone # for sales: | 6042634214 |
| E-mail address: | petroosp@gmail.com |
Click here for more information about our publications!
PRINT THIS ARTICLE

Request Information From Our Sponsors
- StockCharts.com, Inc.
- Candle Patterns
- Candlestick Charting Explained
- Intermarket Technical Analysis
- John Murphy on Chart Analysis
- John Murphy's Chart Pattern Recognition
- John Murphy's Market Message
- MurphyExplainsMarketAnalysis-Intermarket Analysis
- MurphyExplainsMarketAnalysis-Visual Analysis
- StockCharts.com
- Technical Analysis of the Financial Markets
- The Visual Investor
- VectorVest, Inc.
- Executive Premier Workshop
- One-Day Options Course
- OptionsPro
- Retirement Income Workshop
- Sure-Fire Trading Systems (VectorVest, Inc.)
- Trading as a Business Workshop
- VectorVest 7 EOD
- VectorVest 7 RealTime/IntraDay
- VectorVest AutoTester
- VectorVest Educational Services
- VectorVest OnLine
- VectorVest Options Analyzer
- VectorVest ProGraphics v6.0
- VectorVest ProTrader 7
- VectorVest RealTime Derby Tool
- VectorVest Simulator
- VectorVest Variator
- VectorVest Watchdog